As an application management and integration platform, KubeVela needs to handle thousands of applications in production scenario. To evaluate the performance of KubeVela, develop team has conducted performance tests based on simultated environments and demonstrated the capability of managing a large number of applications concurrently.
Setup
Cluster Environment
Working with large clusters requires lots of resources, such as Machines, Network Bandwidth, Storages and many other devices. Therefore, KubeVela team adopts kubemark, an official tool provided by kubernetes, to simulate large clusters by mocking hundreds of kubelets. Each kubelet works like a real node except that they do not run real containers inside pods. The aim of KubeVela performance test mainly focus on whether KubeVela controller can manage thousands of applications effectively, instead of pulling images or executing commands inside pods. As a result, we only need to get resources hosting these fake nodes, also named as hollow-nodes.
We set up the Kubernetes clusters on Alibaba Cloud which includes 5 master nodes and 15 worker nodes. The master nodes wil host Kubernetes core components such as kube-apiserver and kube-controller-manager. The worker nodes need to run other pressure-test related componets, including monitoring tools, KubeVela controller and kubemark pods. Since the major target is to test the performance of KubeVela controller, we do not expect other components to be the bottleneck of the pressure test. To this end, both master nodes and worker nodes are equiped with 32 cores and 128 Gi memory. We use the combination of Prometheus, Loki and Grafana as the monitoring suites and grant them enough resources in avoid of crash caused by Out-of-Memory.
Notice that KubeVela controller and monitoring tools need to be placed on real nodes to function while all pods created during performance tests should be assigned to hollow-nodes correctly. To achieve that, we give different taints to hollow-nodes and real nodes, and add corresponding tolerations to different pods.
Application
To simulate real applications in production, we design an application template with 2 components and 5 functional traits, including
- 1 webservice component
- a scaler trait setting its replica to 3
- a sidecar trait attaching another container to each pod
- an ingress trait generating one ingress instance and one service instance
- 1 worker component
- a scaler trait also setting its replica to 3
- a configmap trait generating a new configmap and attaching it to worker pods
In the following experiment, we test the performance of KubeVela controller managing 3,000 Applications (12,000 Pods in total) on 200 nodes. Applications are created in parallel at first, then kept running for a while, and finally deleted from the cluster. Each application will be reconciled multiple times with latencies and consumed resources recorded by monitoring tools.
In practice, we also have another trait used for adding tolerations as described above.
KubeVela Controller
The KubeVela controller is set up with a group of recommendation configurations as follows
- Kubernetes Resource
- 0.5 core CPU
- 1 Gi Memory
- 1 replica
- Program
- concurrent-reconciles=2 (The number of reconcile threads)
- kube-api-qps=300 (The qps of kubernetes client used in controller)
- kube-api-burst=500 (The burst of kubernetes client used in controller)
- informer-re-sync-interval=20m (The interval of routine reconciles.) We will analyze these settings in the below sections.
To evaluate the performance of KubeVela Controller itself, we disabled the Ingress MutatingWebhook and Application ValidatingWebhook which is beyond the focus of this test but will affect the performance of KubeVela Controller by increasing the latency of creating/patching resources.
Experiments
Creation
The creation of all 3,000 applications lasted 25min. Getting all pods running takes a bit longer time, which is out of the scope of KubeVela controller.
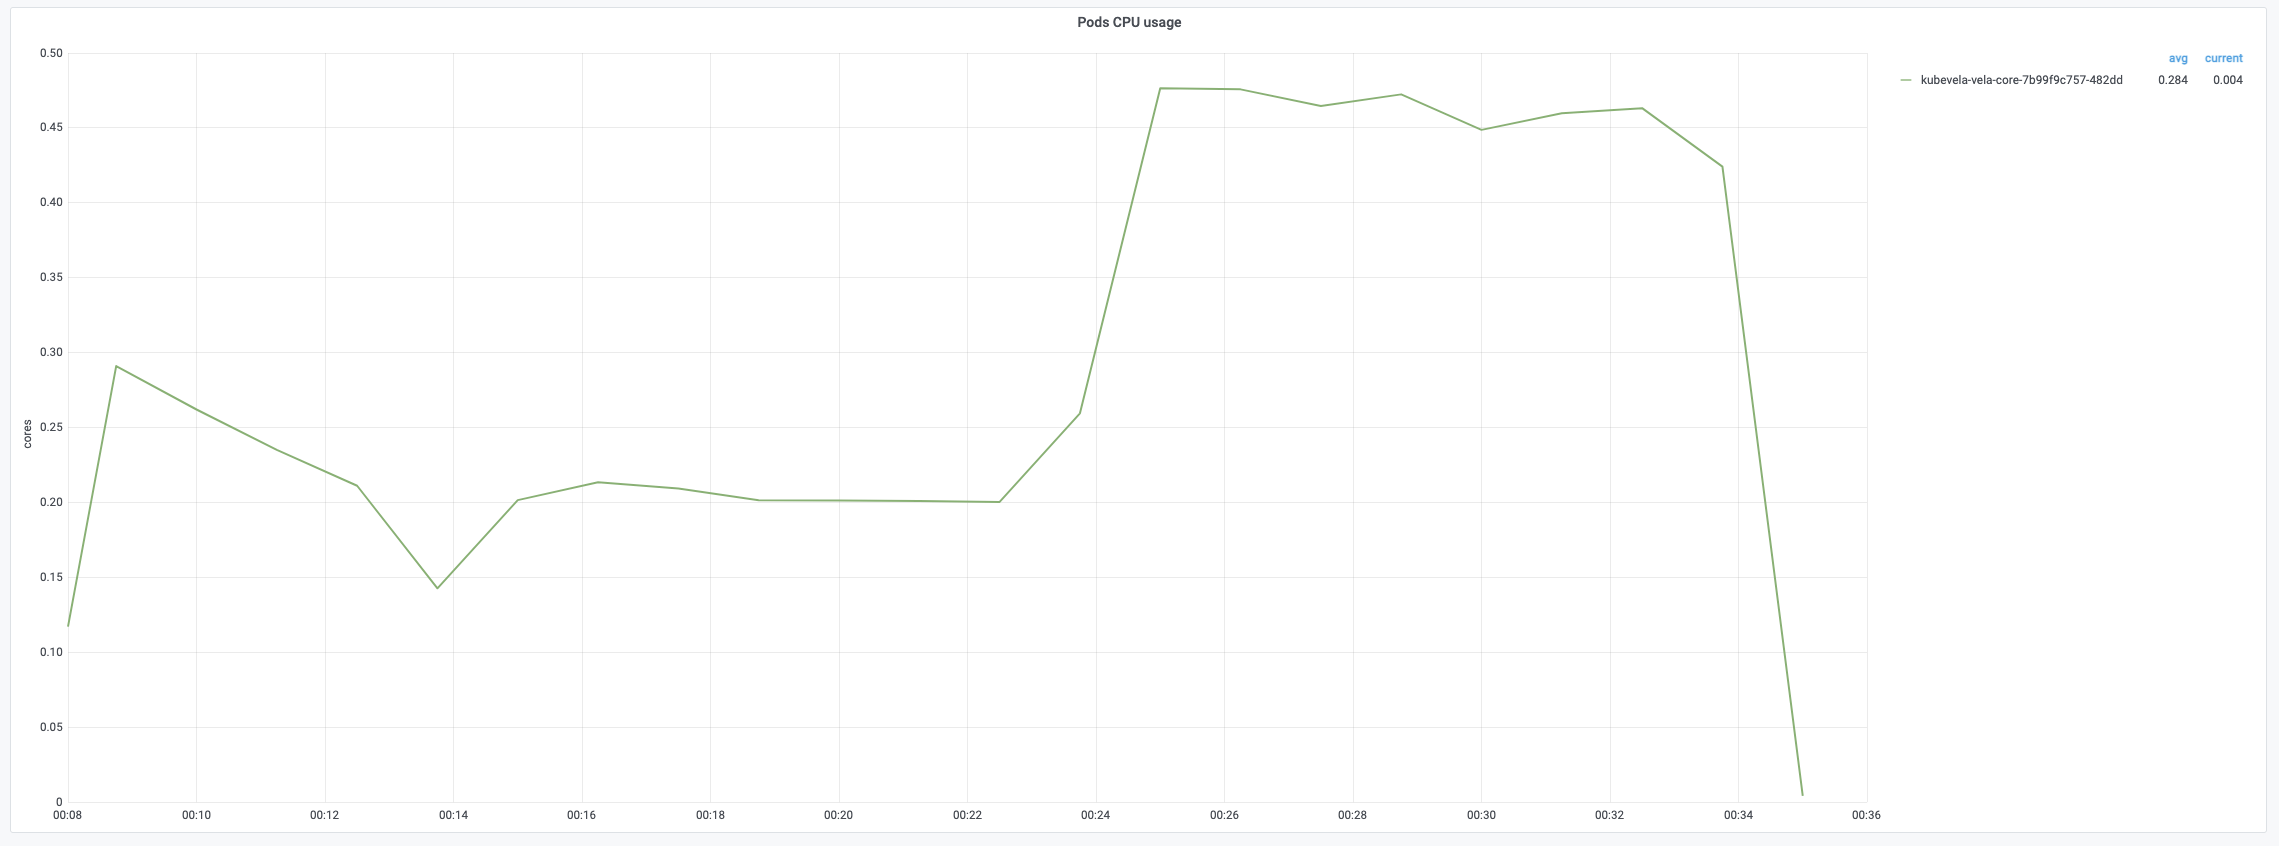
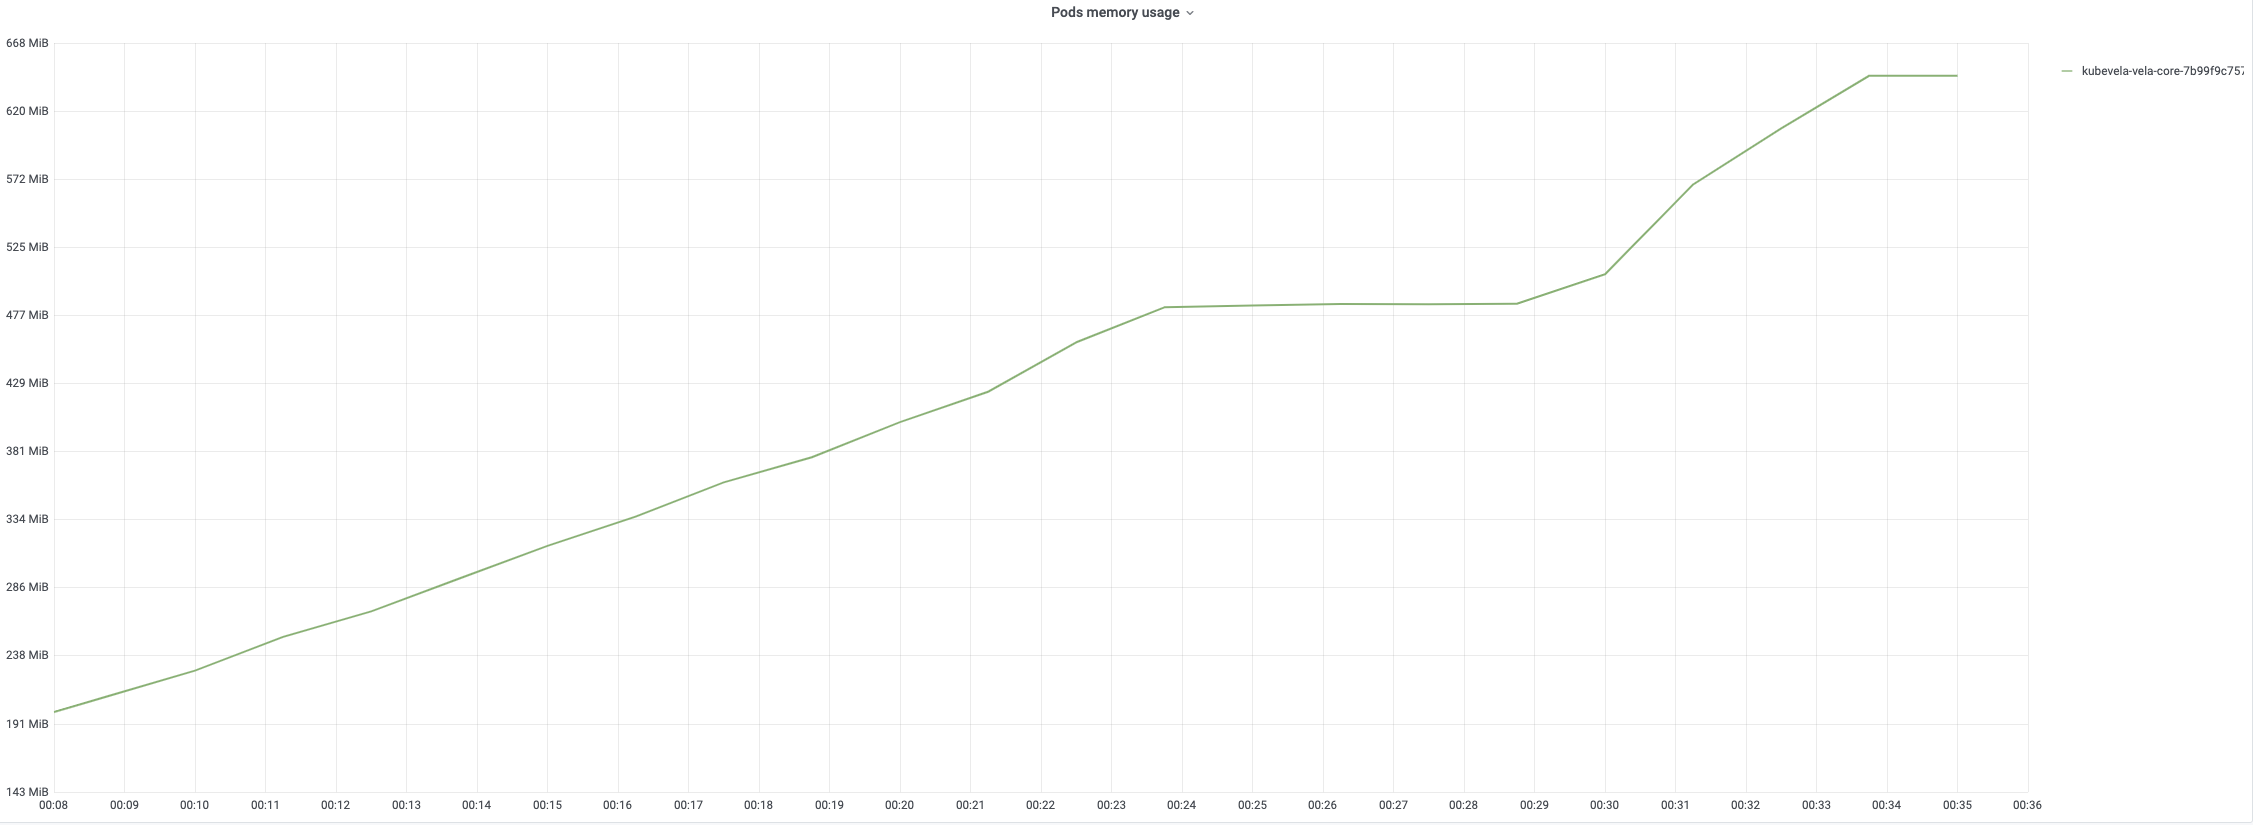
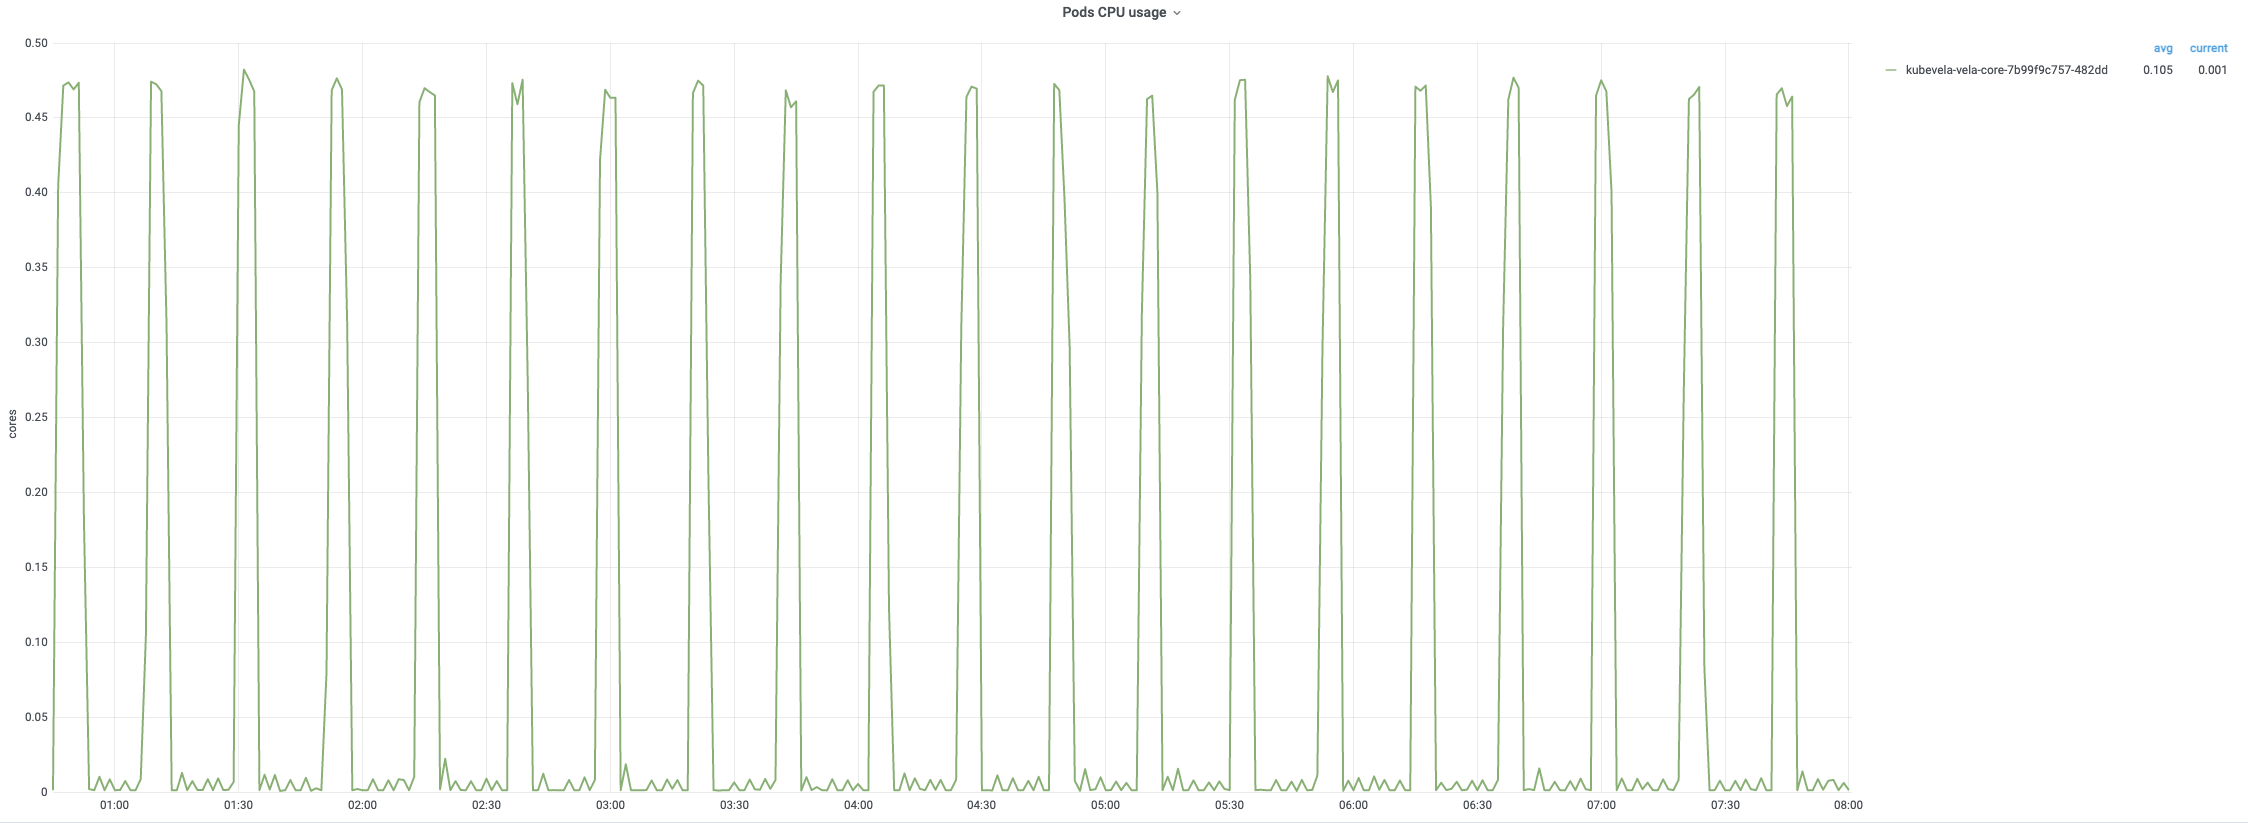
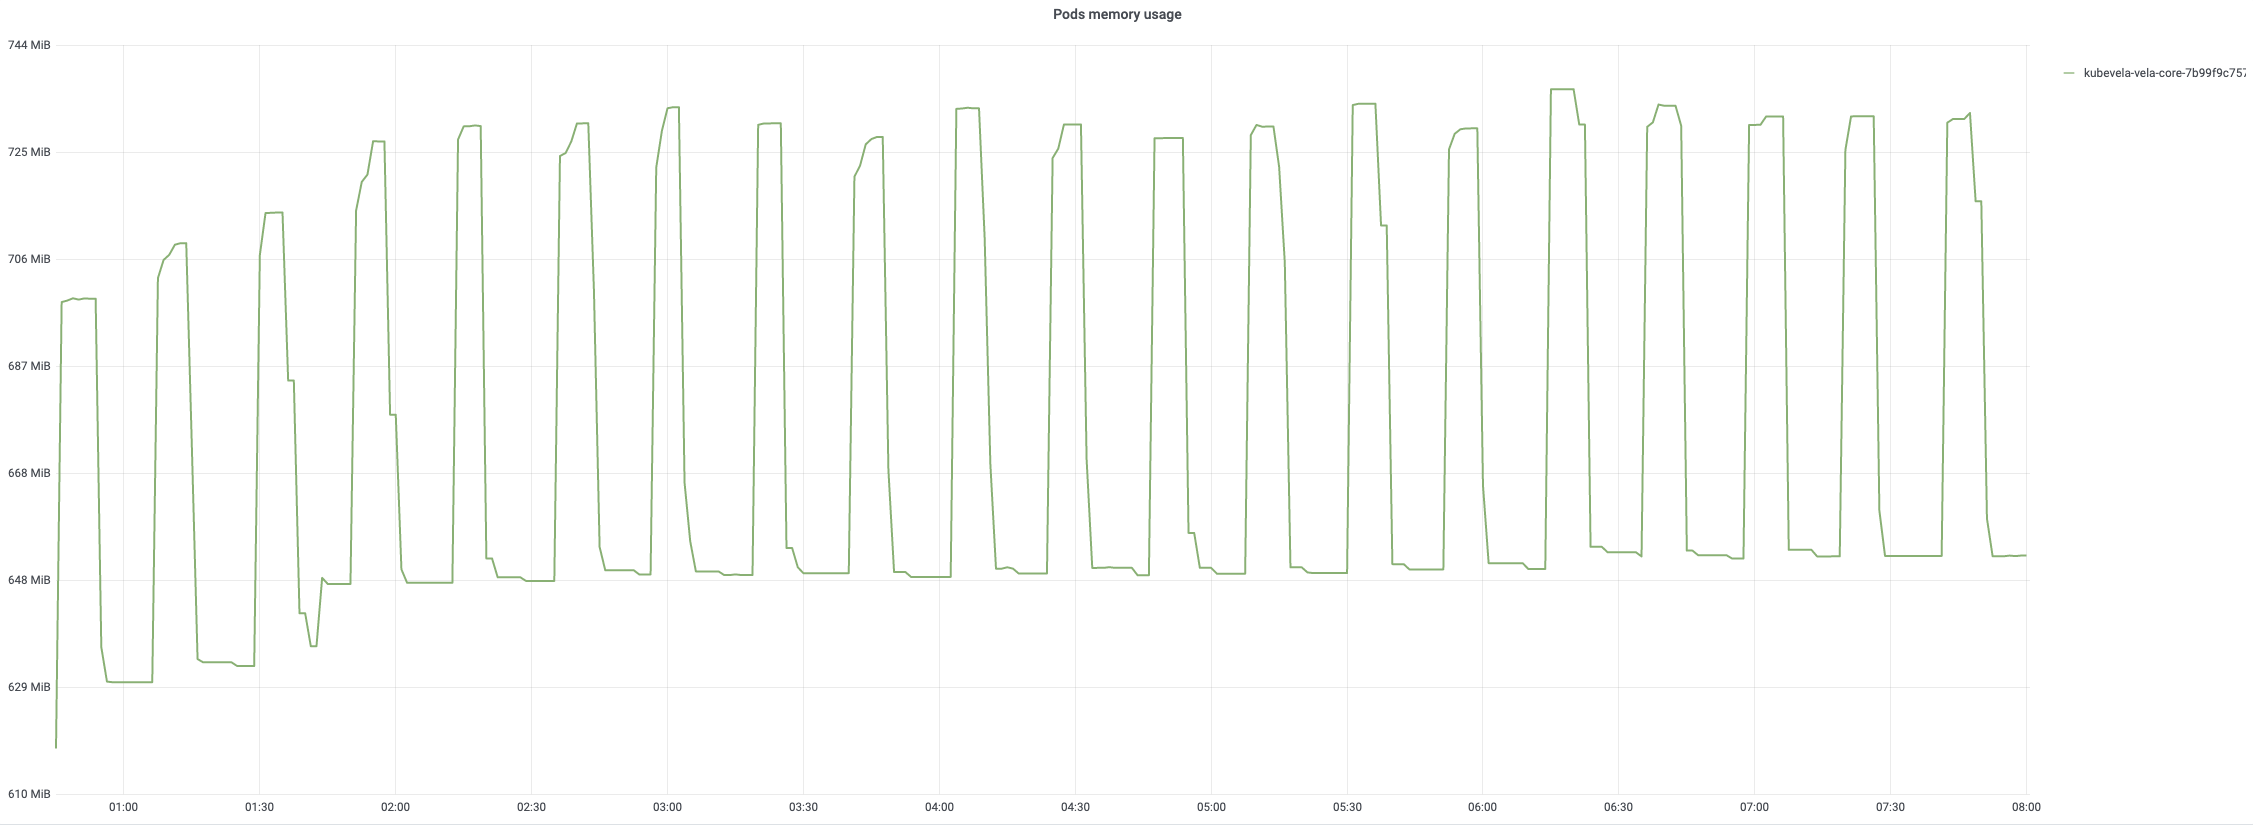
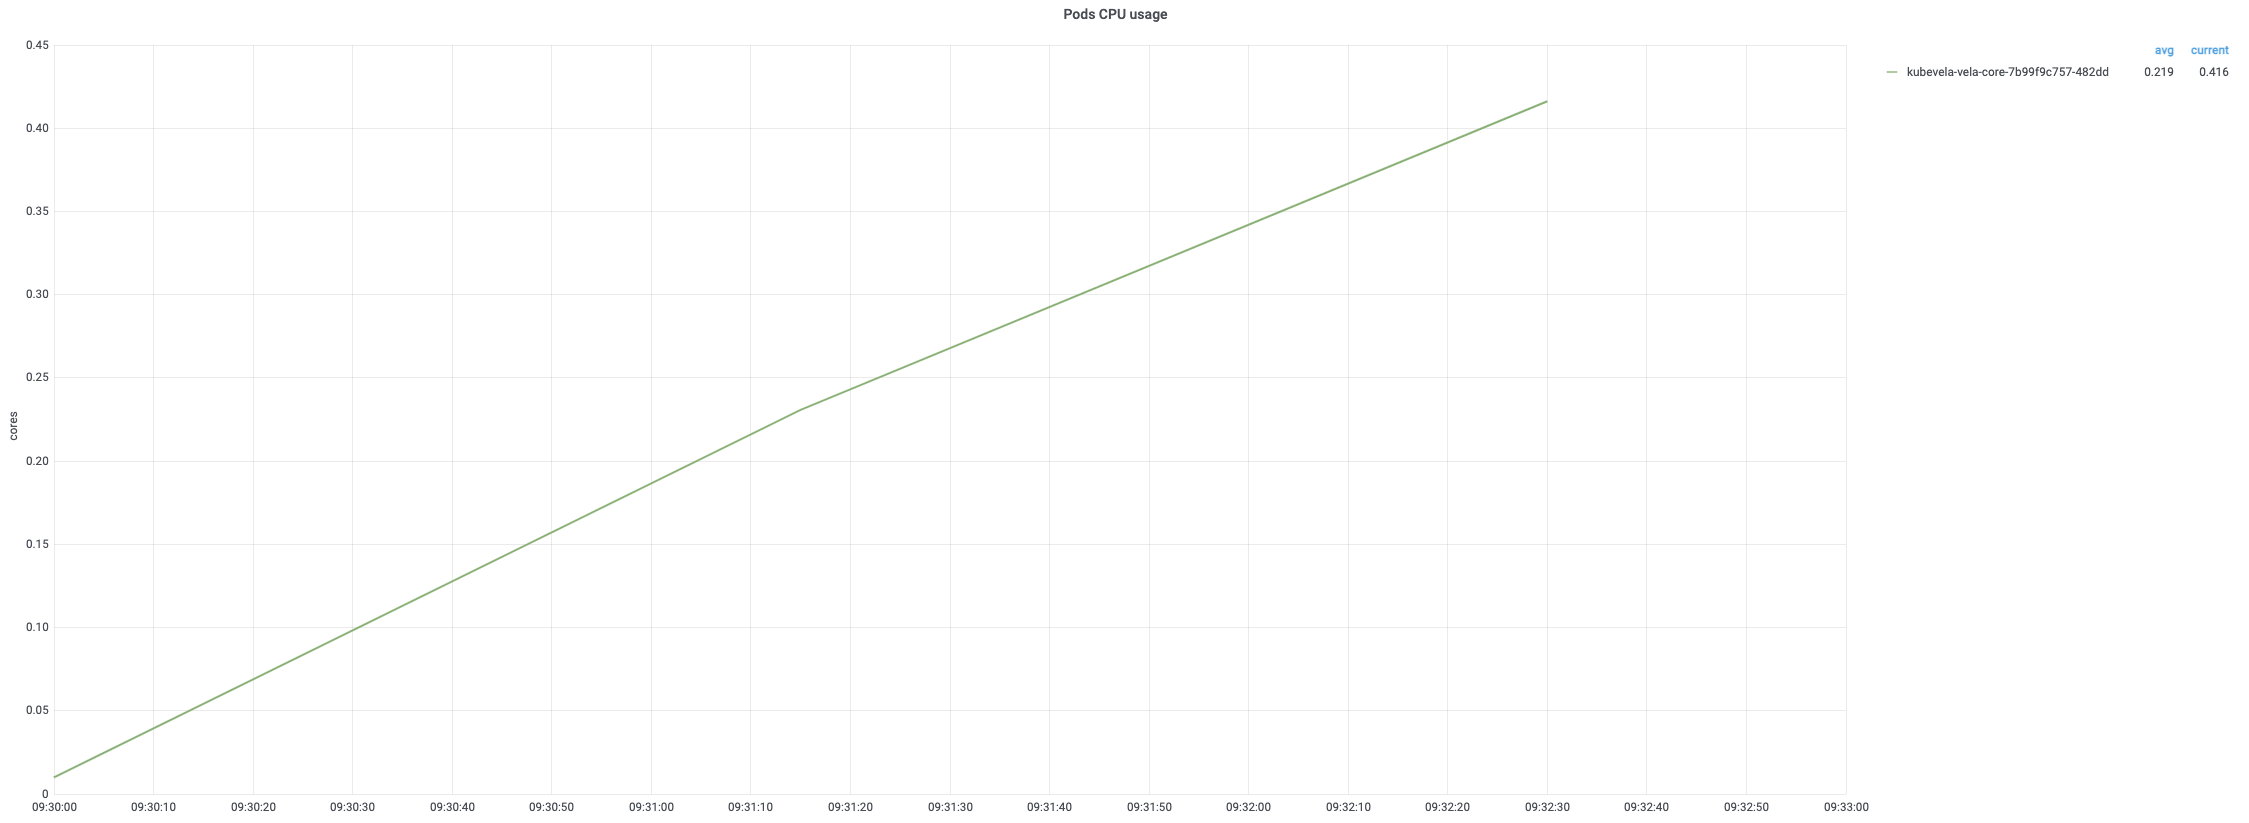
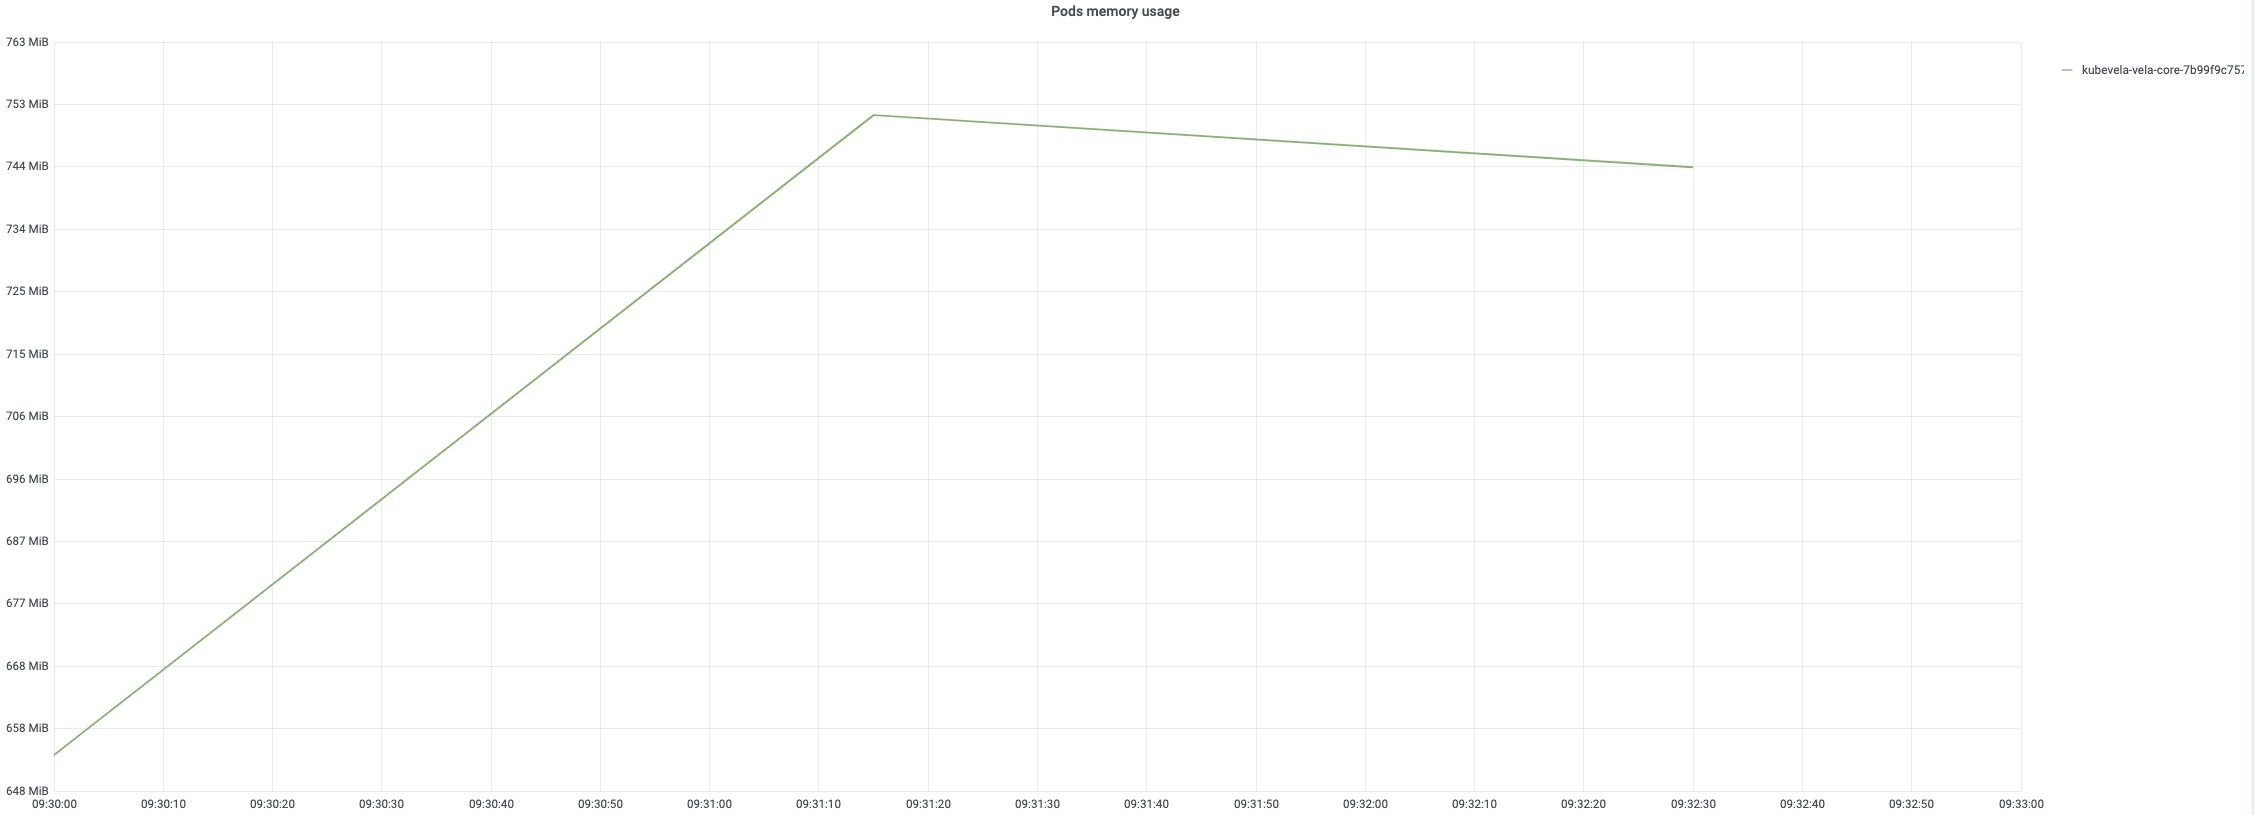
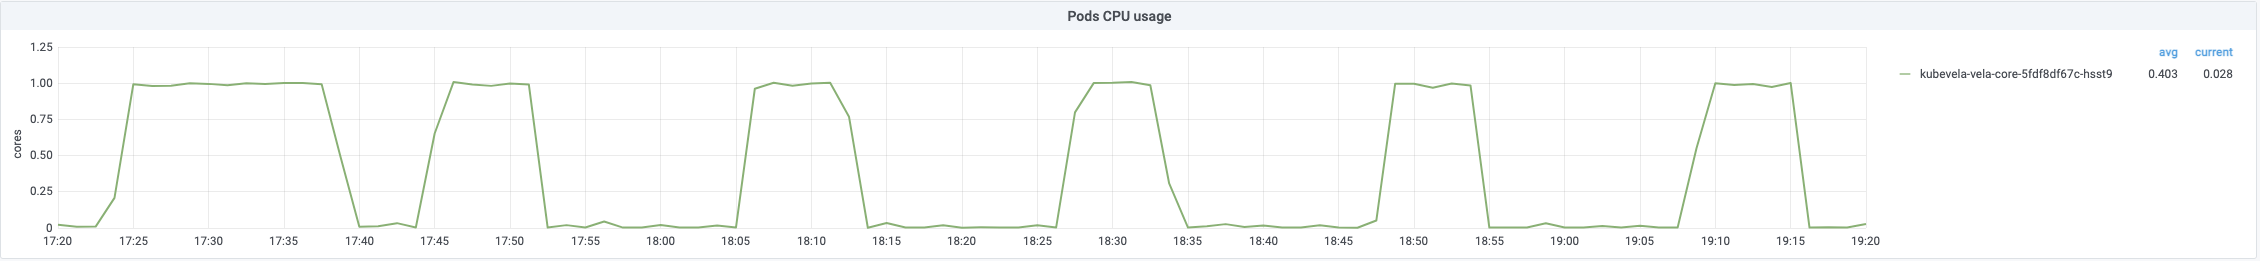
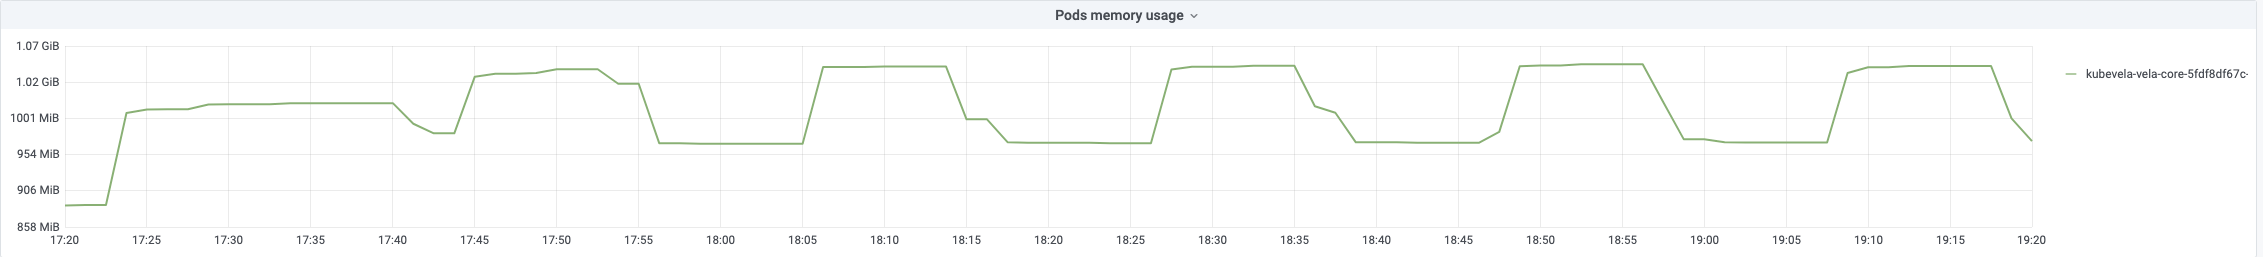
For each application creation, it will trigger three turns of reconciling. The usage of CPU will reach 100% in the late period of creation. The memory usage will increase as the number of applications rises. It reaches around 67% at the end of creation.
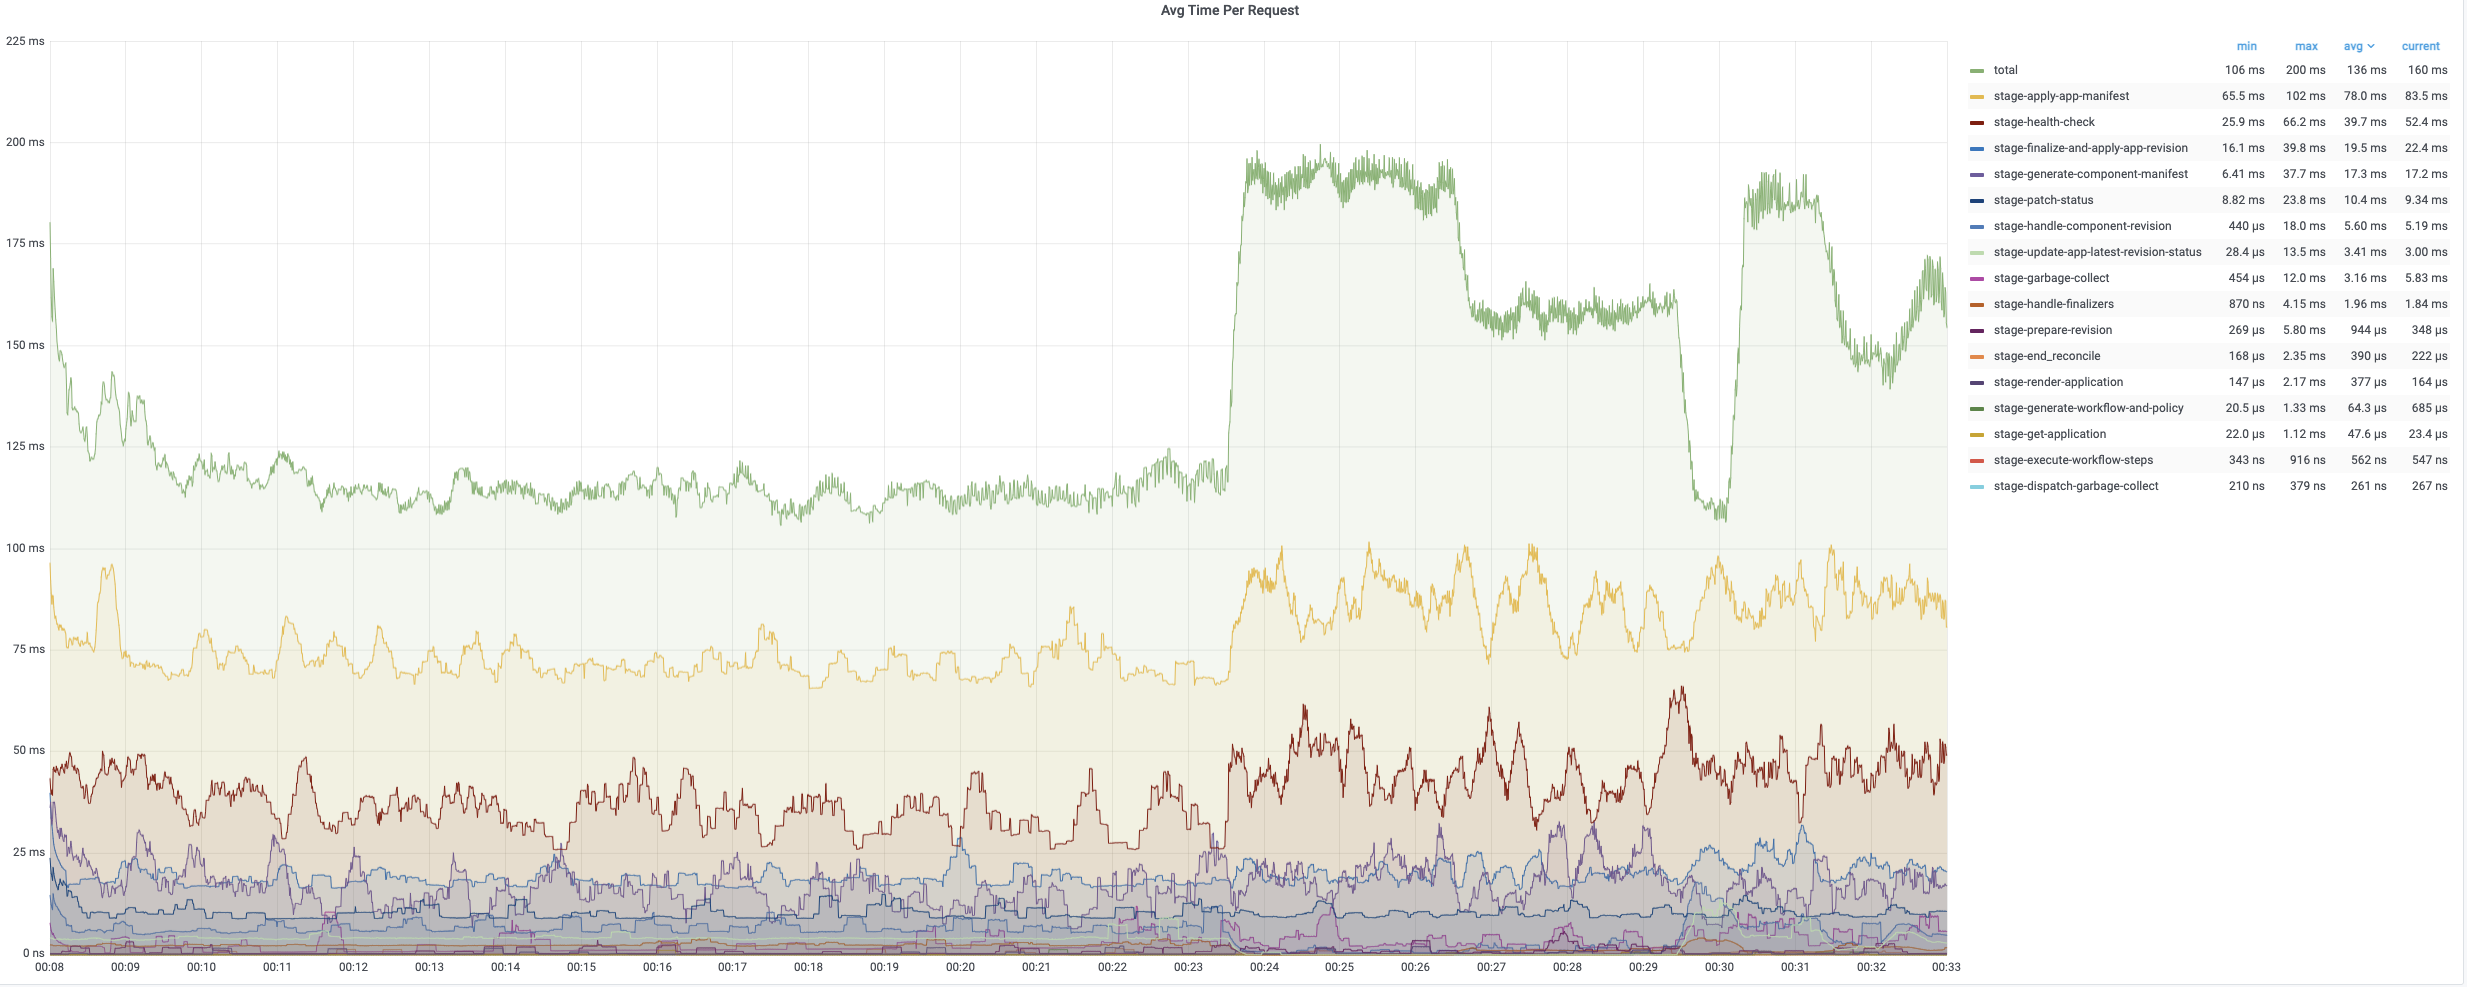
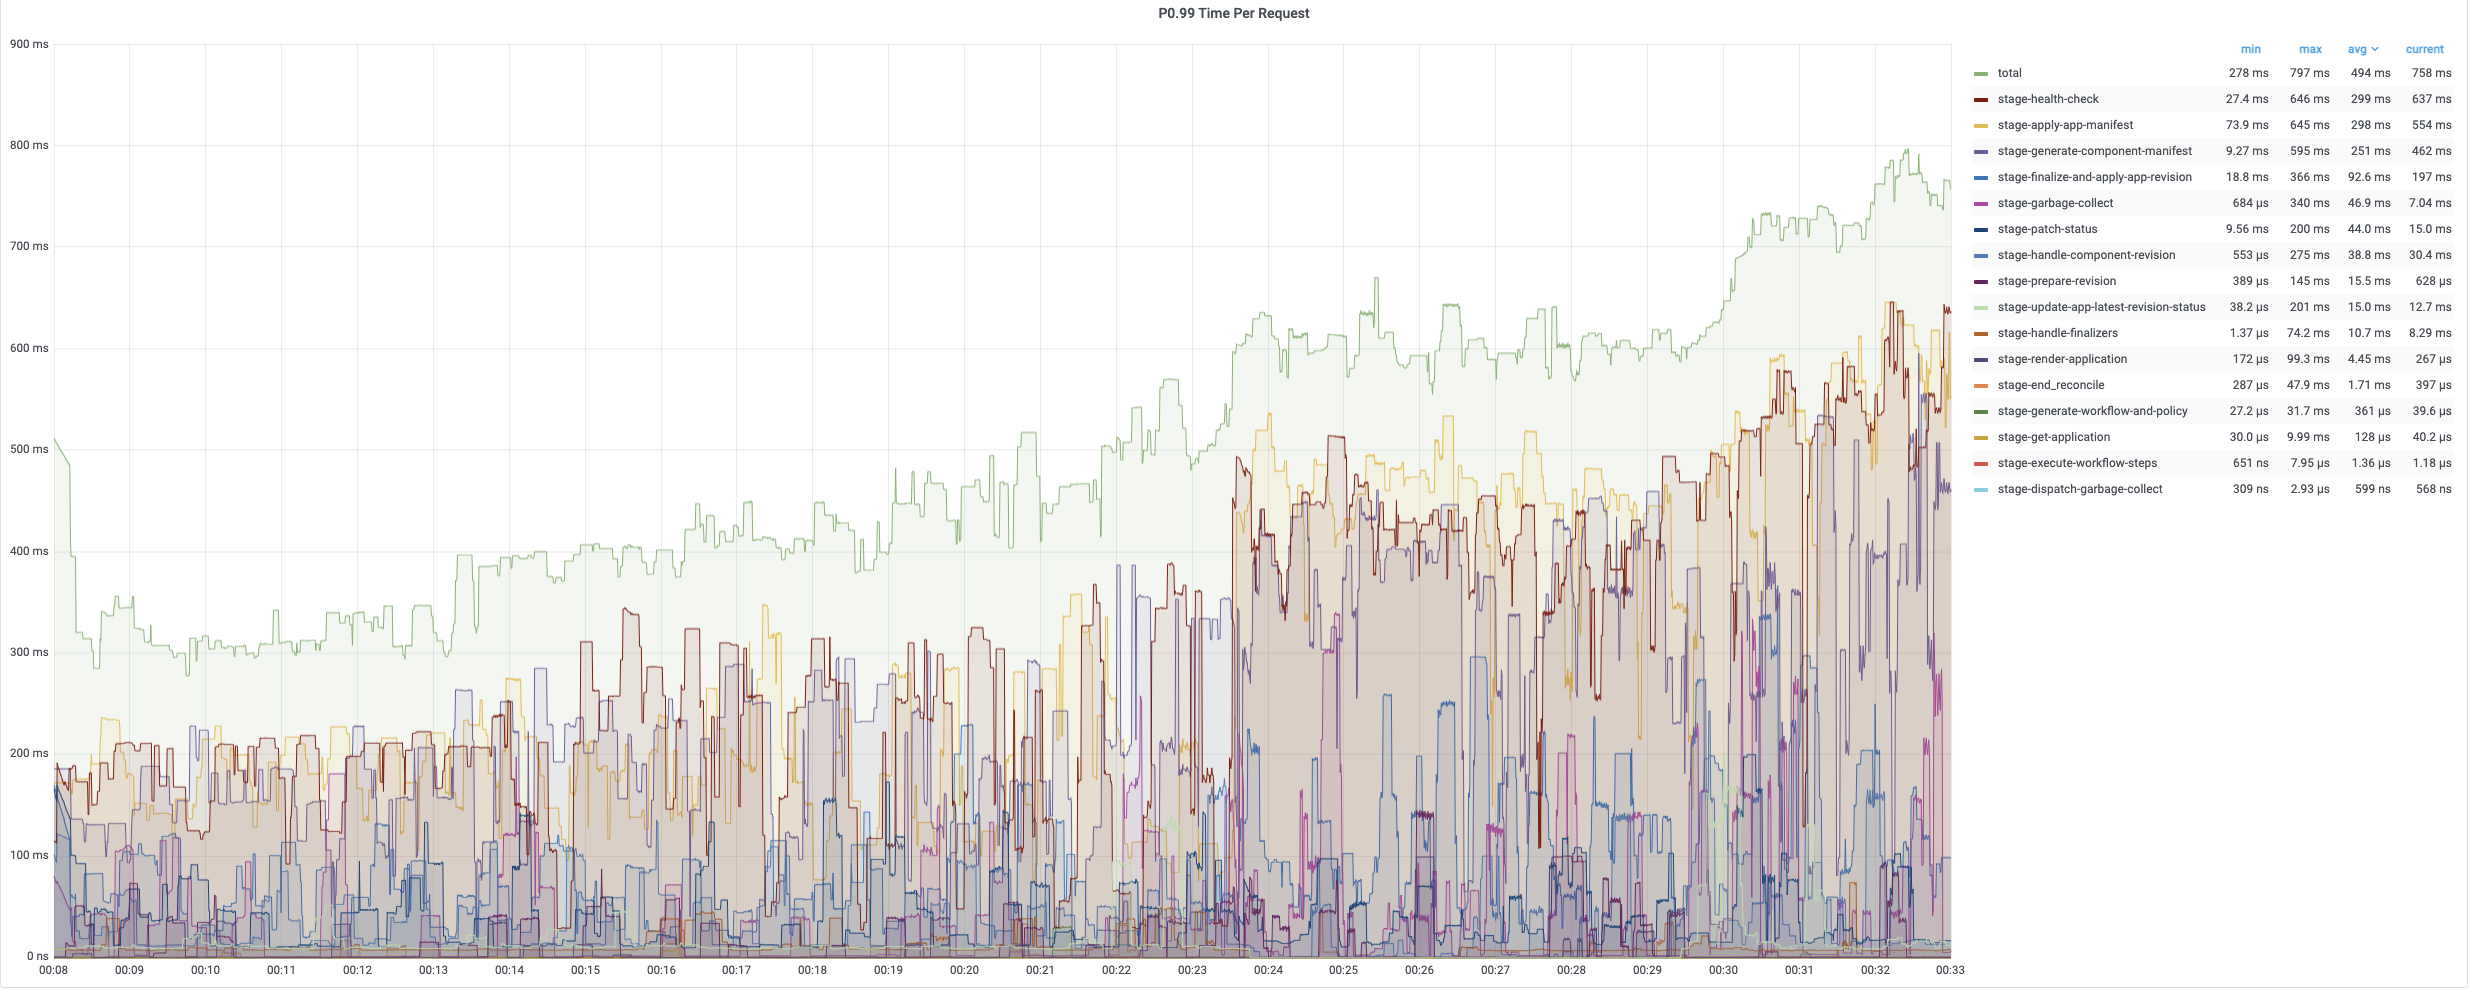
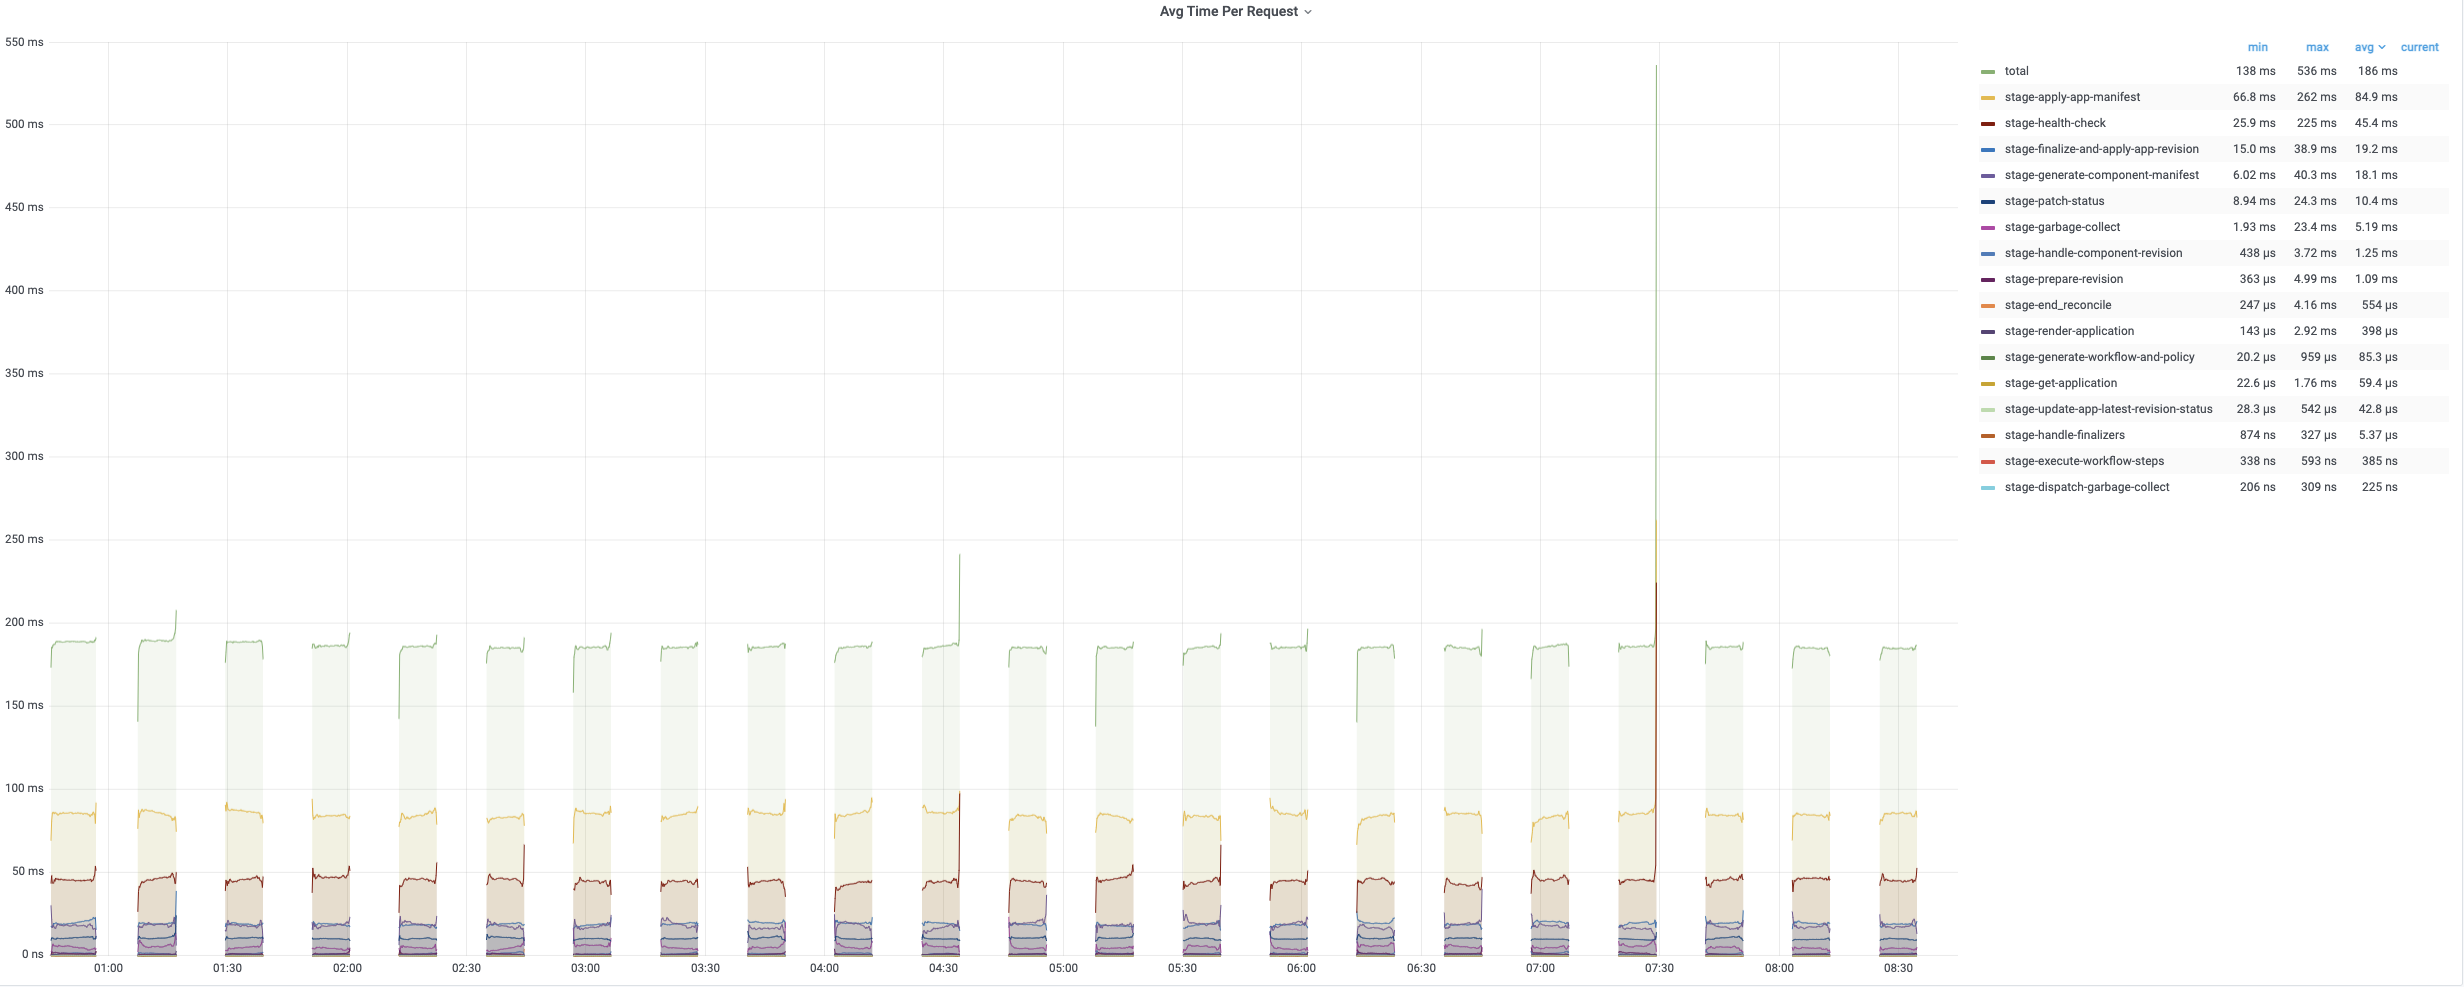
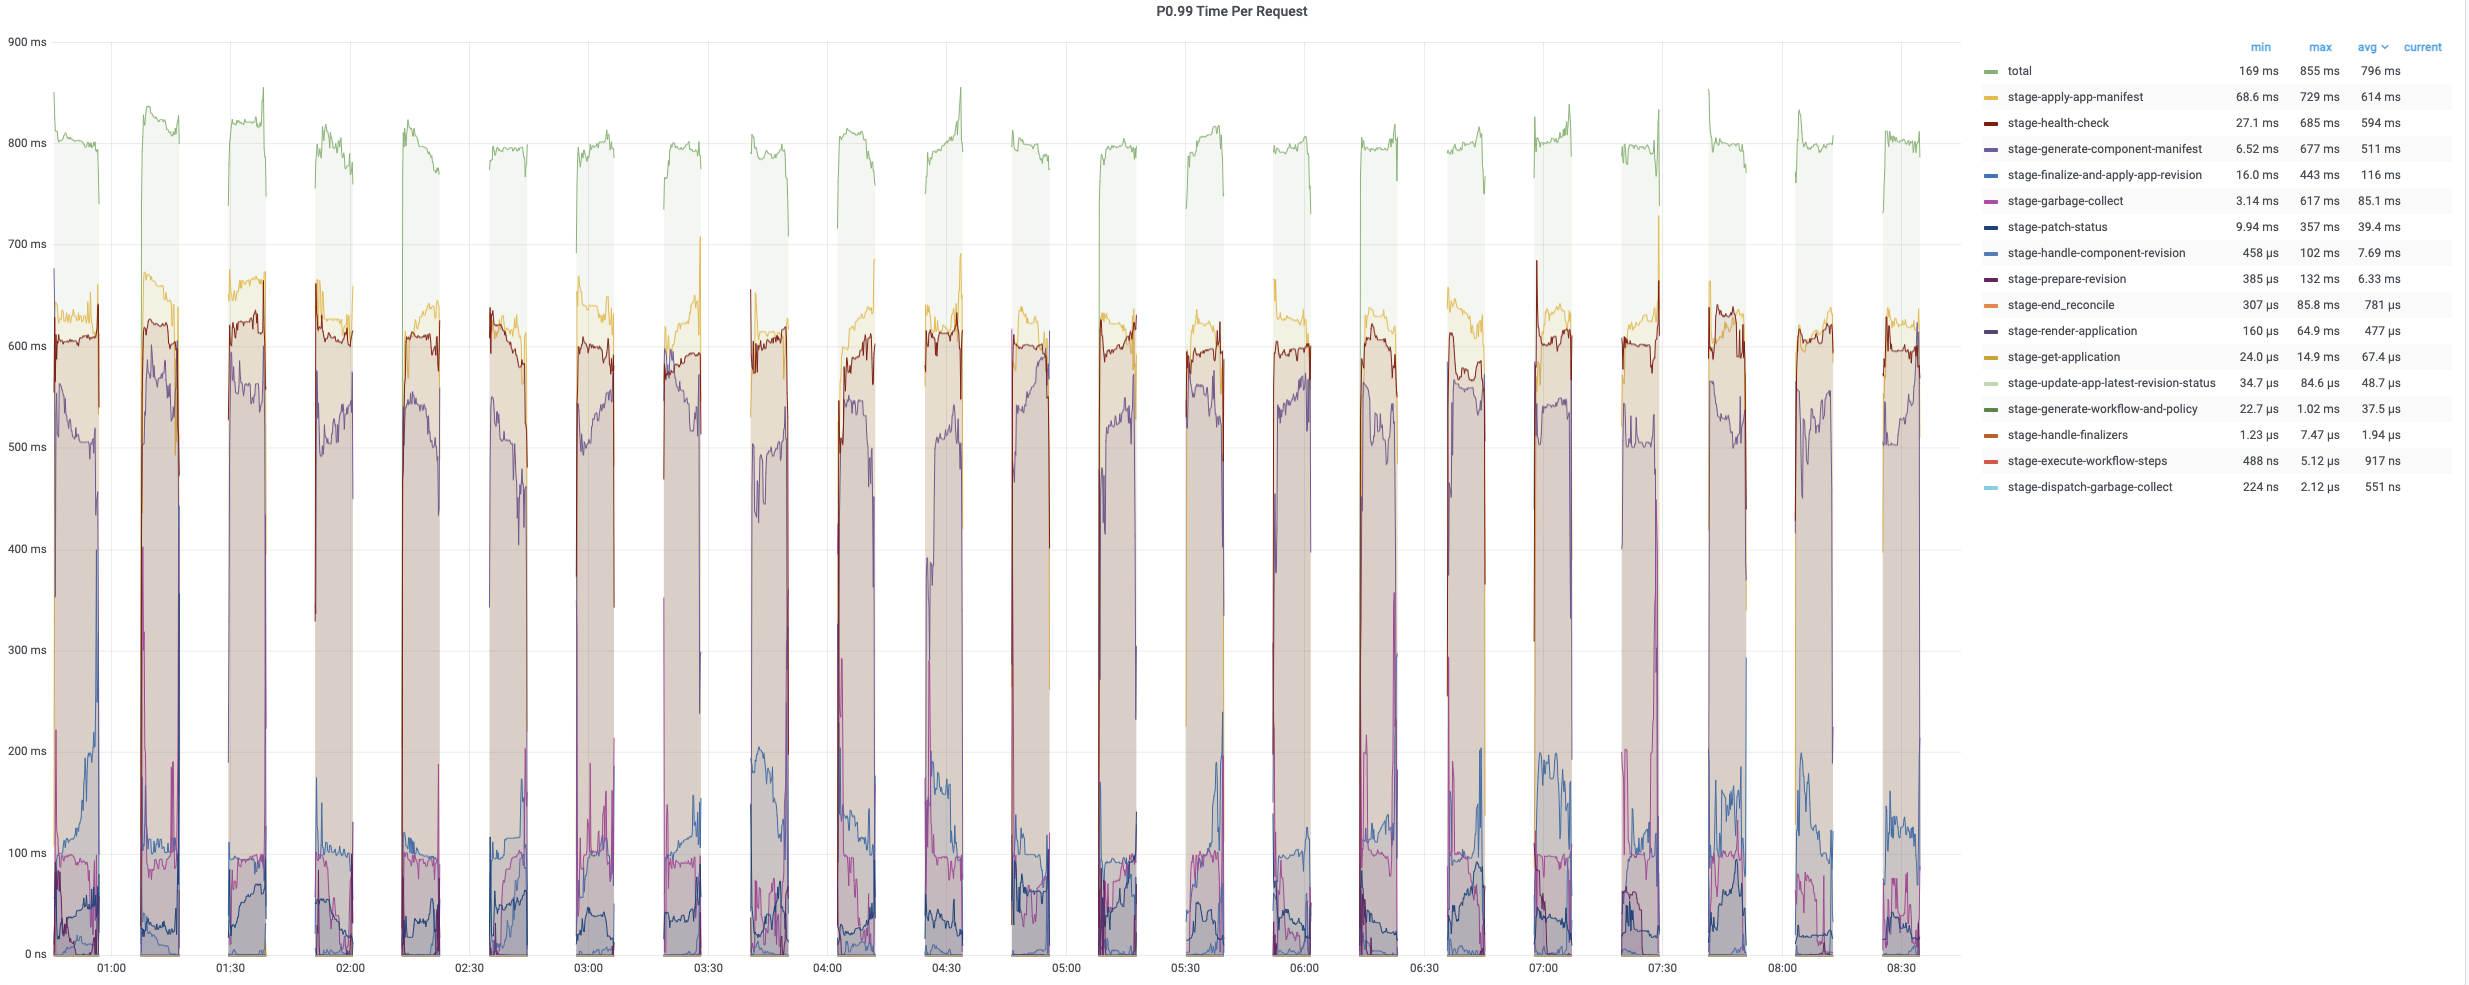
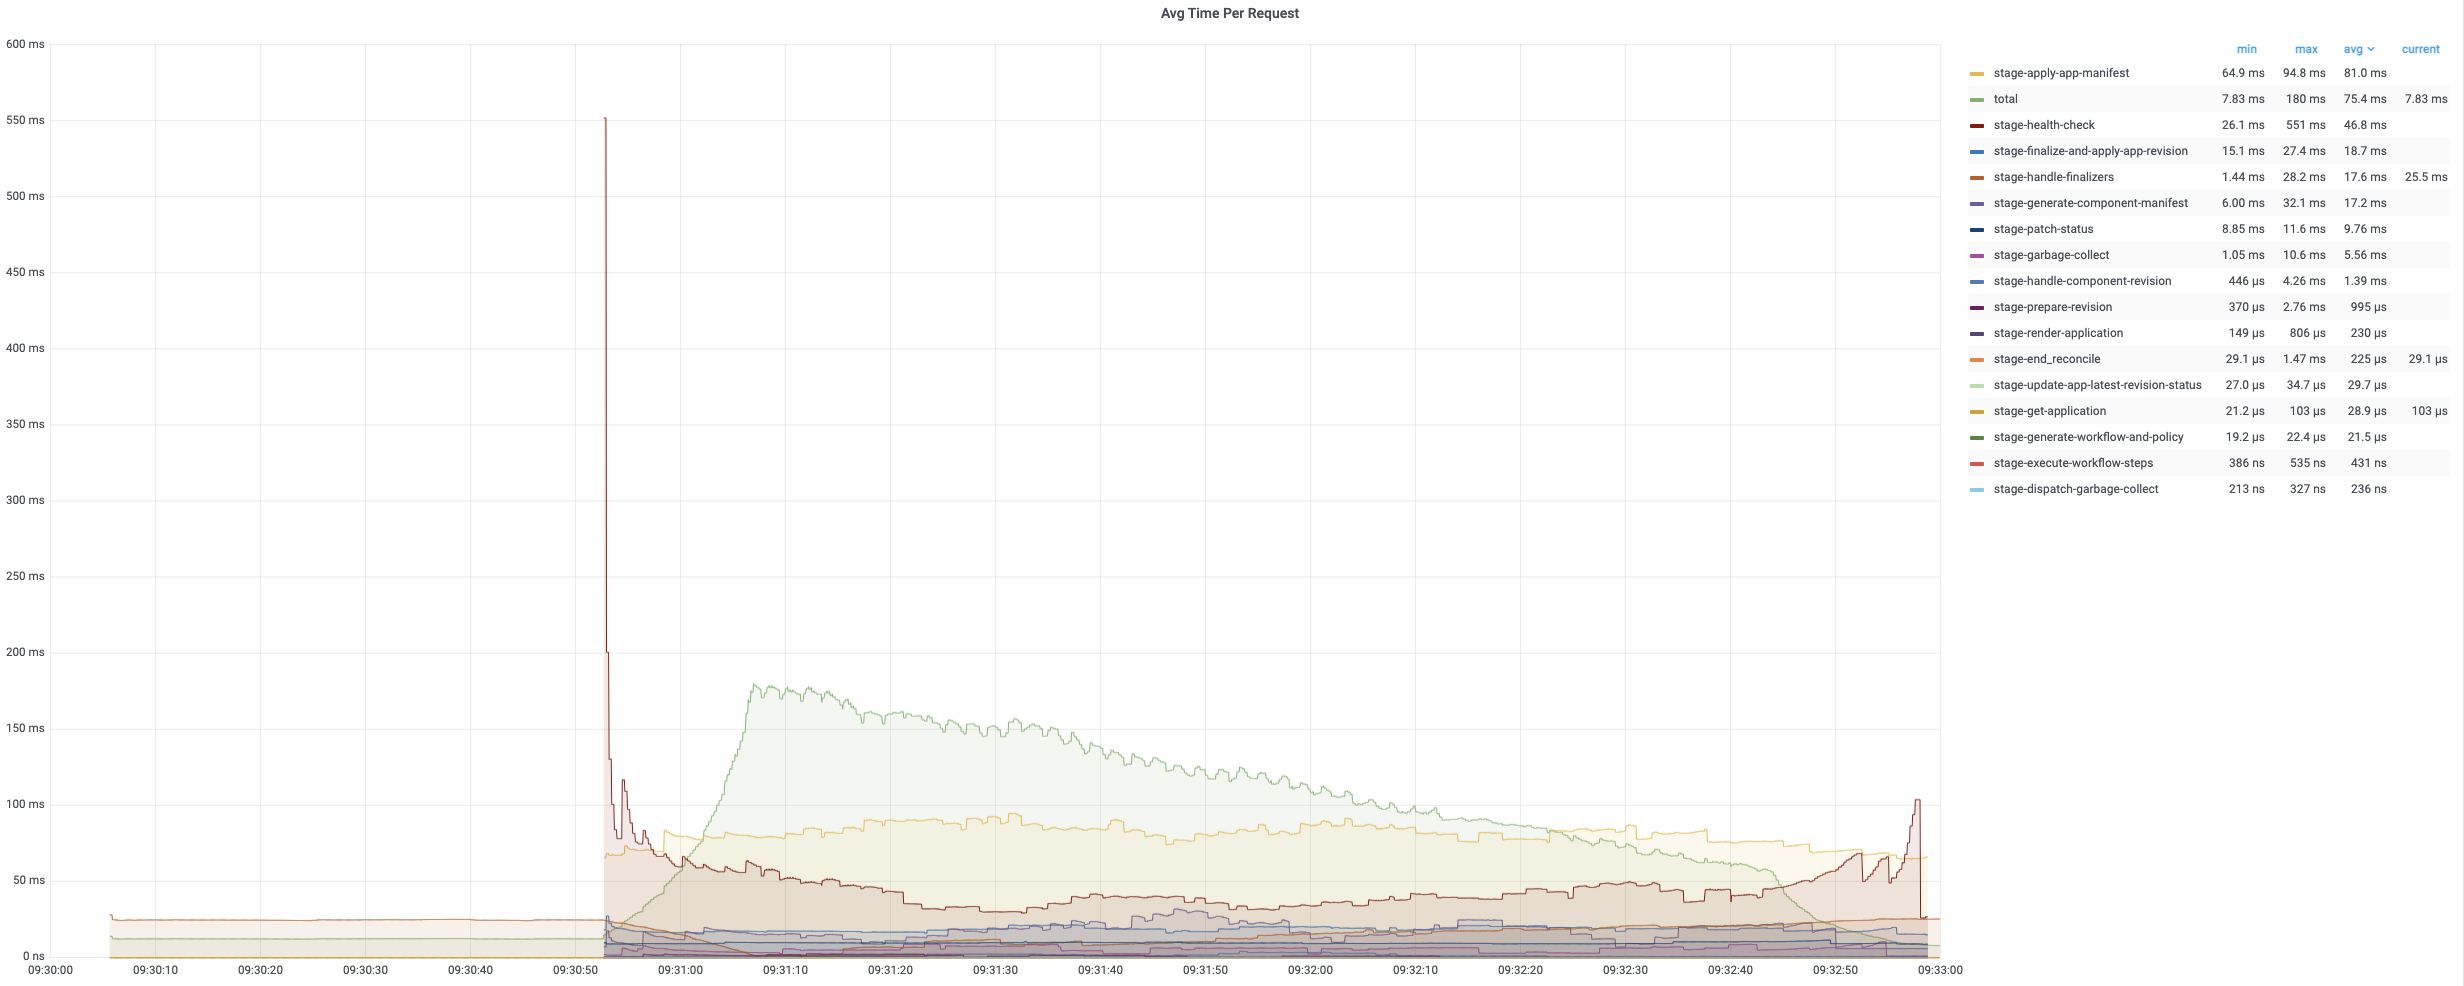
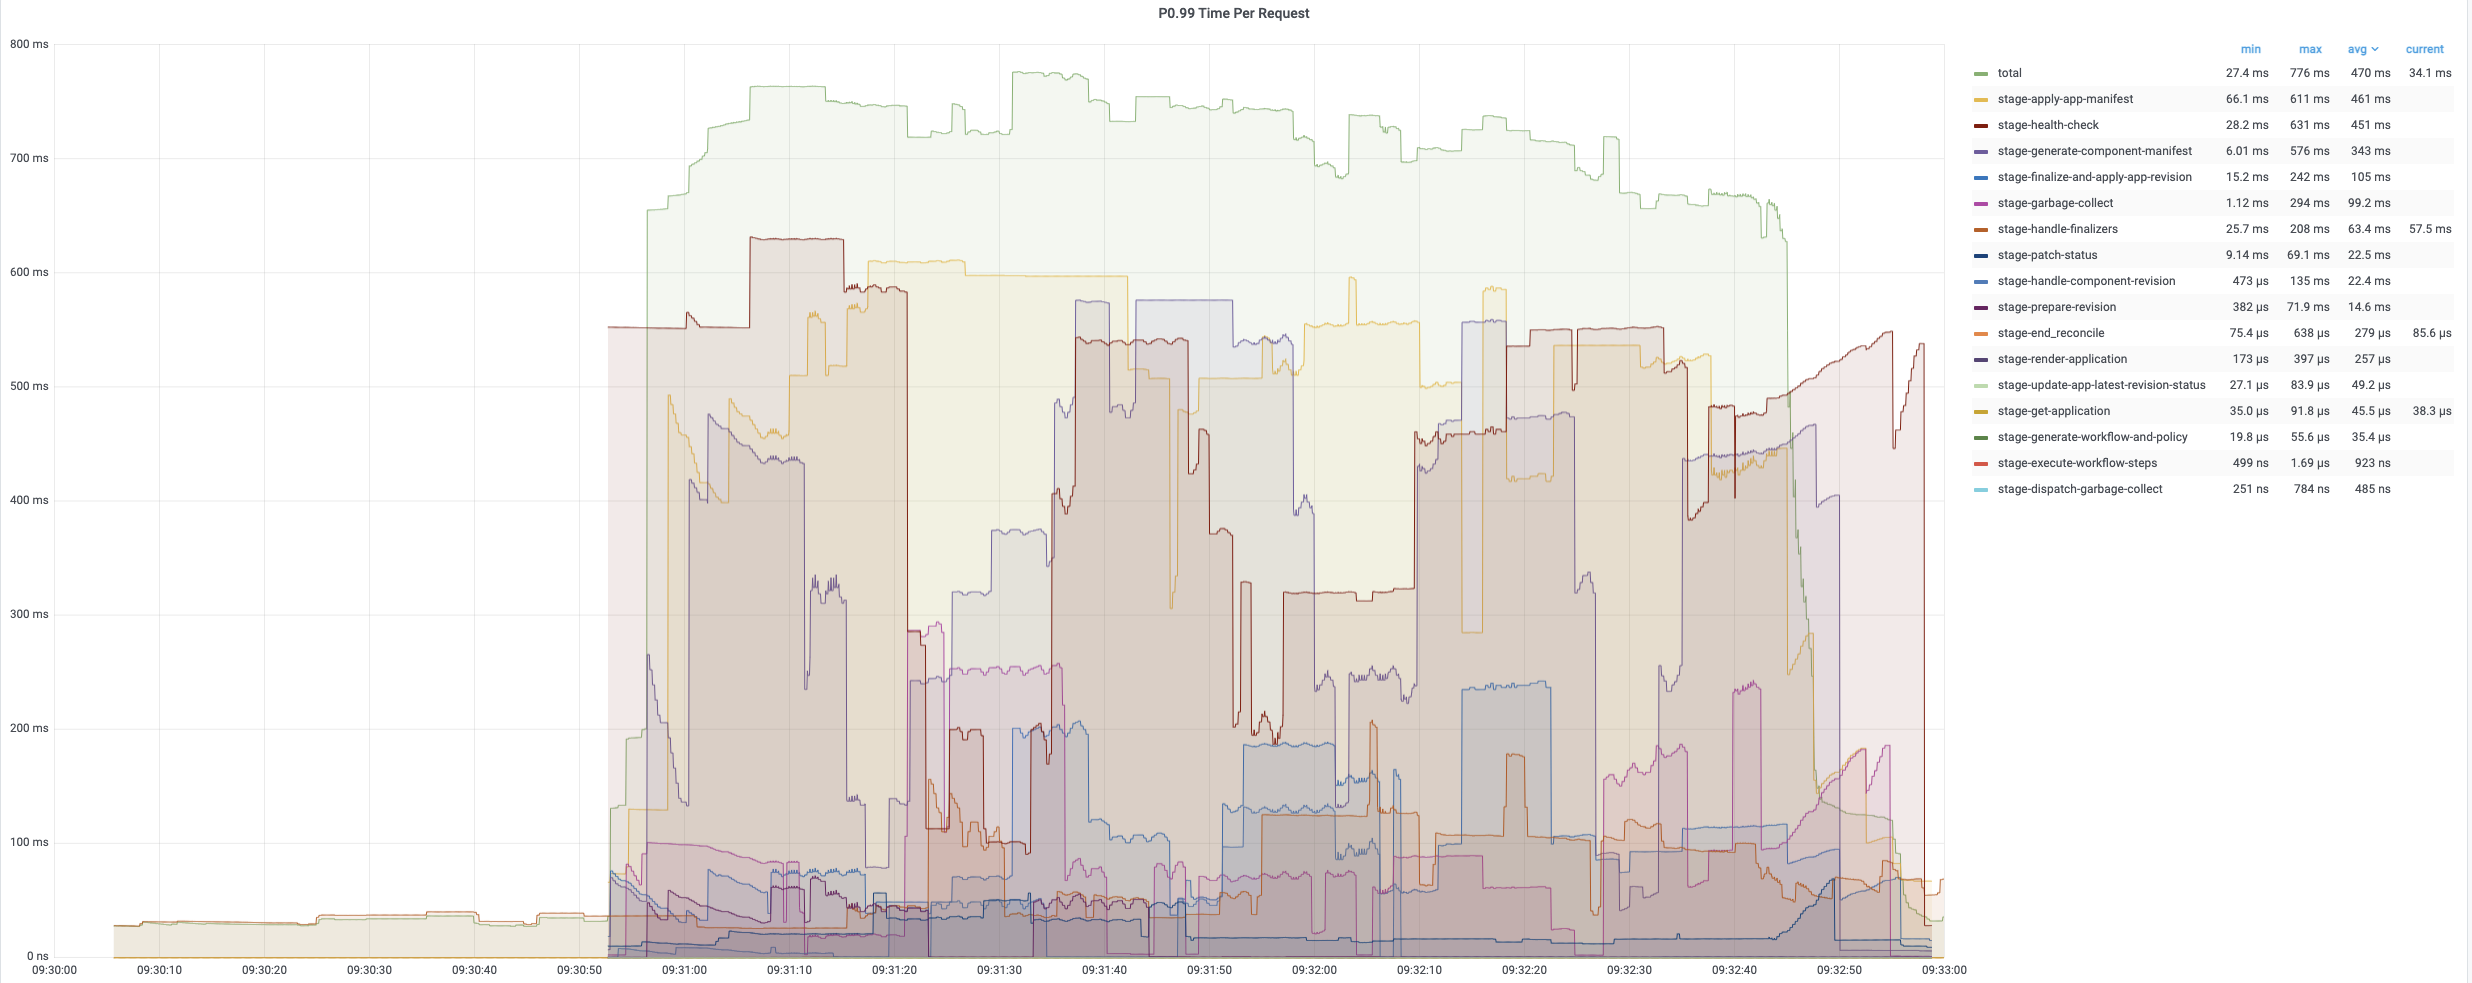
The average time of the first turn reconciling is relatively short since it only needs patch finalizer. The second and third turn reconciling contain full reconcile cycles and need more time to process. The following charts record the time consumptions of different period during reconciling applications. The average time is generally below 200ms while 99% of reconciles uses less than 800ms.
Regular Reconciles
After creation, applications are reconciled by controller every 20min. the monitoring of 8-hour reconcile process are displayed as below. The CPU usage will come up to 90% once reconcile happens routinely. The memory usage generally keeps a stable pattern, up to 75% memory usage.
The average reconcile time is under 200ms while 99% are about 800ms~900ms. Each regular reconcile for all applications generally takes around 10min.
Deletion
The application deletion process is fast and low-resource consumptive. It takes less than 3min to delete all applications. However, notice that the deletion of resources managed by application usually takes longer time. This is because the cleanup of these resources (such as deployments or pods) are not directly controlled by the KubeVela controller. KubeVela controller takes charge of deleting their owner and cleanup them by triggering cascading deletion. In addition, each deletion is associated with two turns of reconcile where the second turn returns immediately when it fails to retrieve target application (since it is deleted).
Analysis
Number of Applications
The experiment displayed above demonstrates a classical scenario for KubeVela. Although 3,000 applications are successfully managed by the KubeVela controller in this case, it is strongly recommended to adopt a smaller number (such as 2,000) of applications with the above configuration for the following reasons: The time and resource consumption is closely associated with the spec of applications. If a lot of users apply larger applications with more pods and more other resources, 3,000 applications might break the resource limit more easily. The memory and CPU usage shown above is approching resource limits. If memory drains, the KubeVela controller will crash and restart. If high CPU usage maintains for a long time, it might cause a long waiting queue in KubeVela controller which further lead to longer response time for application changes.
Configurations
There are several parameters users could config to adapt into their own scenario. Using more replica for KubeVela controller do not scale up the ability of KubeVela controller. The leader election mechanism ensures that only one replica will work while others will wait. The aim of multi-replica is to support fast recovery when the working one crash. However, if the crash is caused by OOM, the recovery usually will not be able to fix that. The number of qps and burst in the program configuration should be increased accordingly while scaling up KubeVela controller. These two parameters limit the capability for controller to send requests to apiserver. Generally, in order to scale up KubeVela controller, scale up the resource limits and all the program parameters mentioned above (except the reconcile interval). If you have more applications to manage, add more memory. If you have higher operation frequency, add more CPU and threads, then increase qps and burst accordingly. Longer reconcile interval allows more applications to handle, at the cost of longer time to fix potential underlying resource problems. For example, if one deployment managed by one application disappears, the routine reconciling can discover this problem and fix it.
Scaling Up
In addition to the experiment described above, we conducted another two experiment to test how well KubeVela controller can scale to larger clusters and more applications.
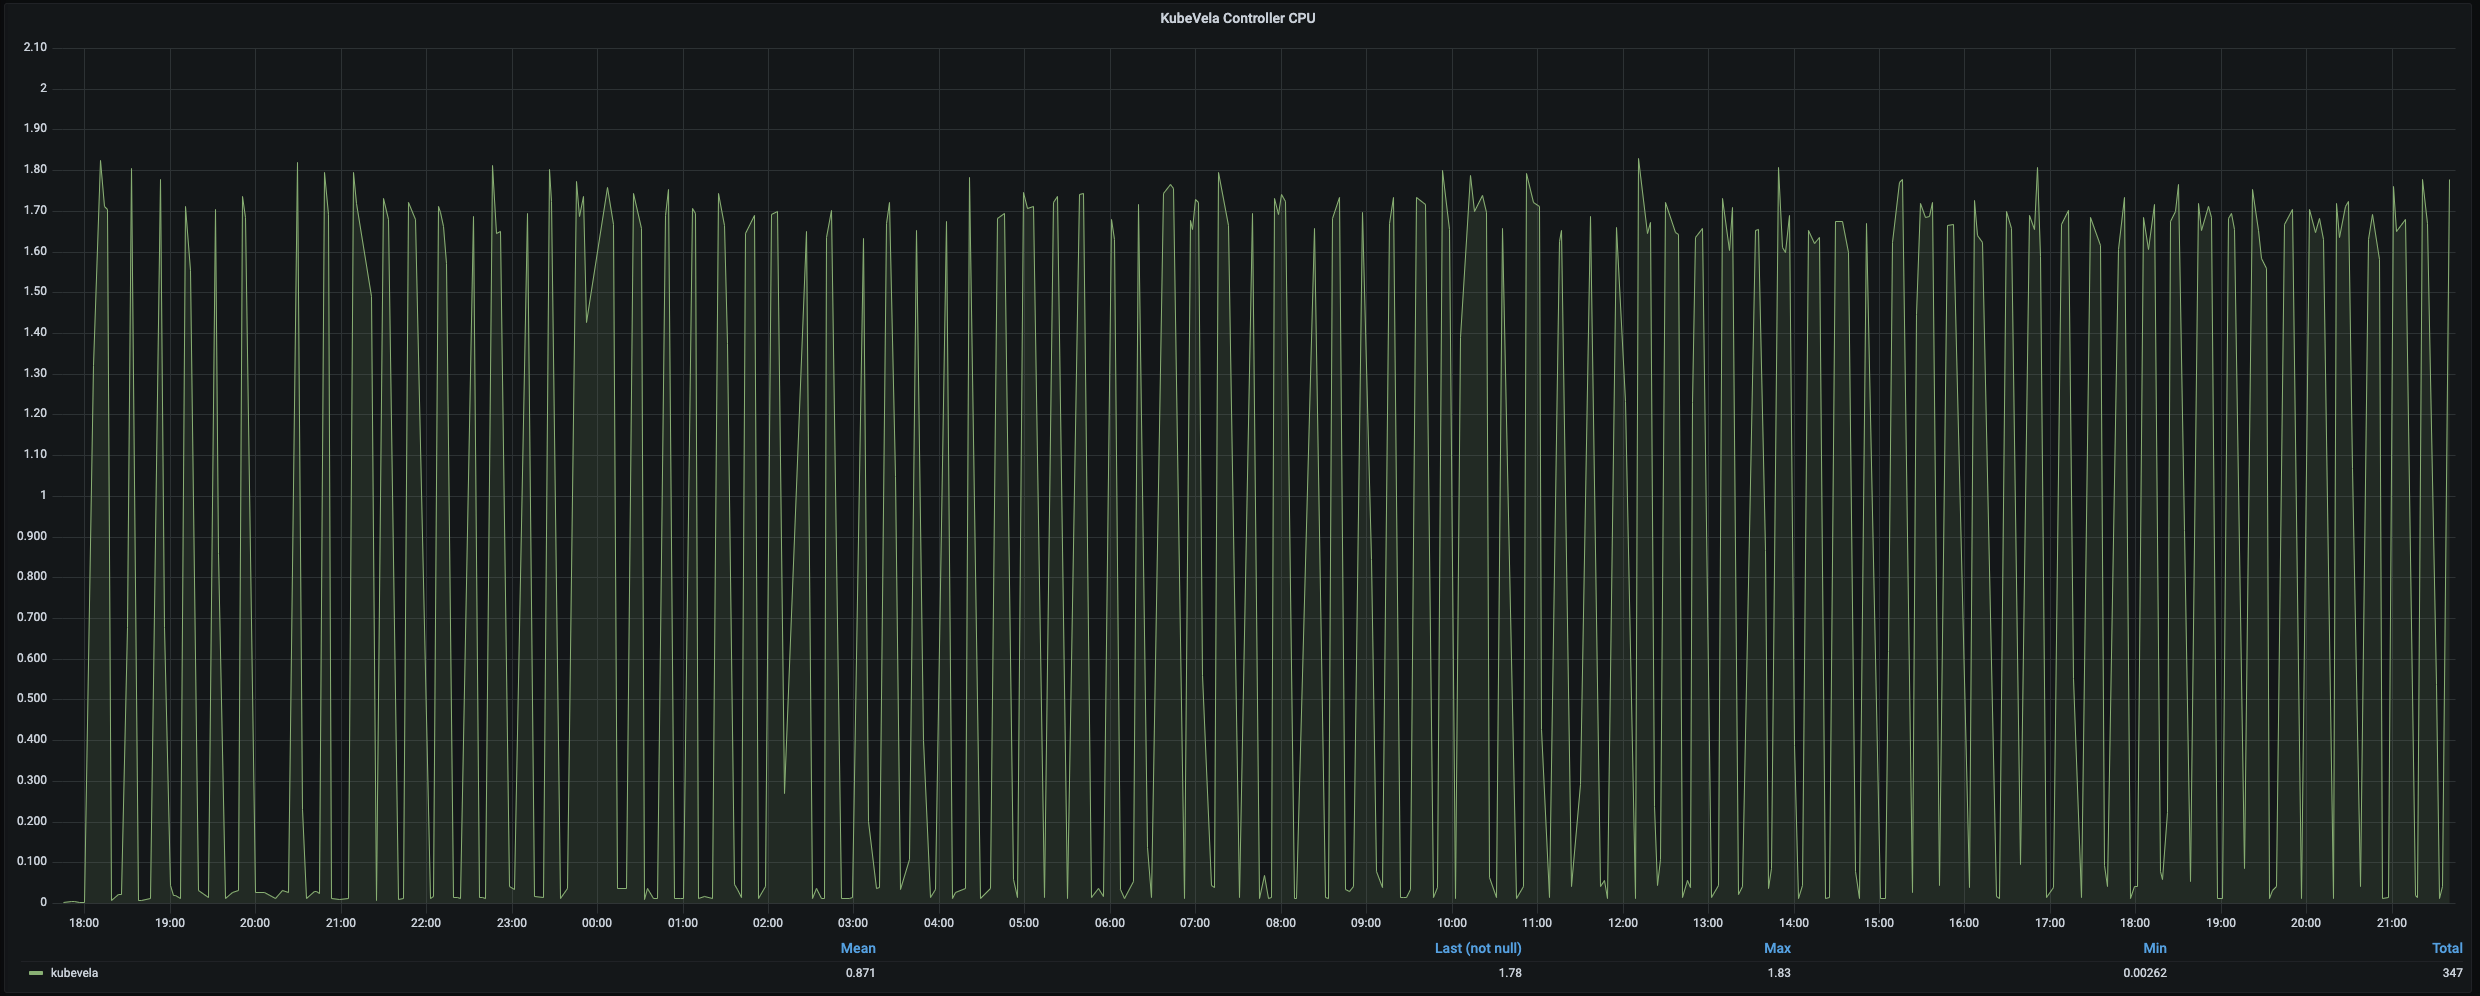
In a 500-node cluster, we tried to create 5,000 applications with the same spec described above, at the speed of 4 per second and lasted for around 21min. 1 core and 2 Gi memory are granted to KubeVela controller with the use of 4 concurrent reconcile threads. The kube-api-qps and kube-api-burst are raised to 500/800 correspondingly. All 30,000 pods successfully turn into Running phase. The time costs for each reconcile is similar to the previous experiment and CPU/Memory cost is not very high compared to the given resources. The regular reconciles for 5,000 applications takes 7~8 minutes, and no significant resource cost is observed. During this scaling, we found that the throughput of kube-apiserver starts to block the creation of application, as too many resources need to be created while applying applications.
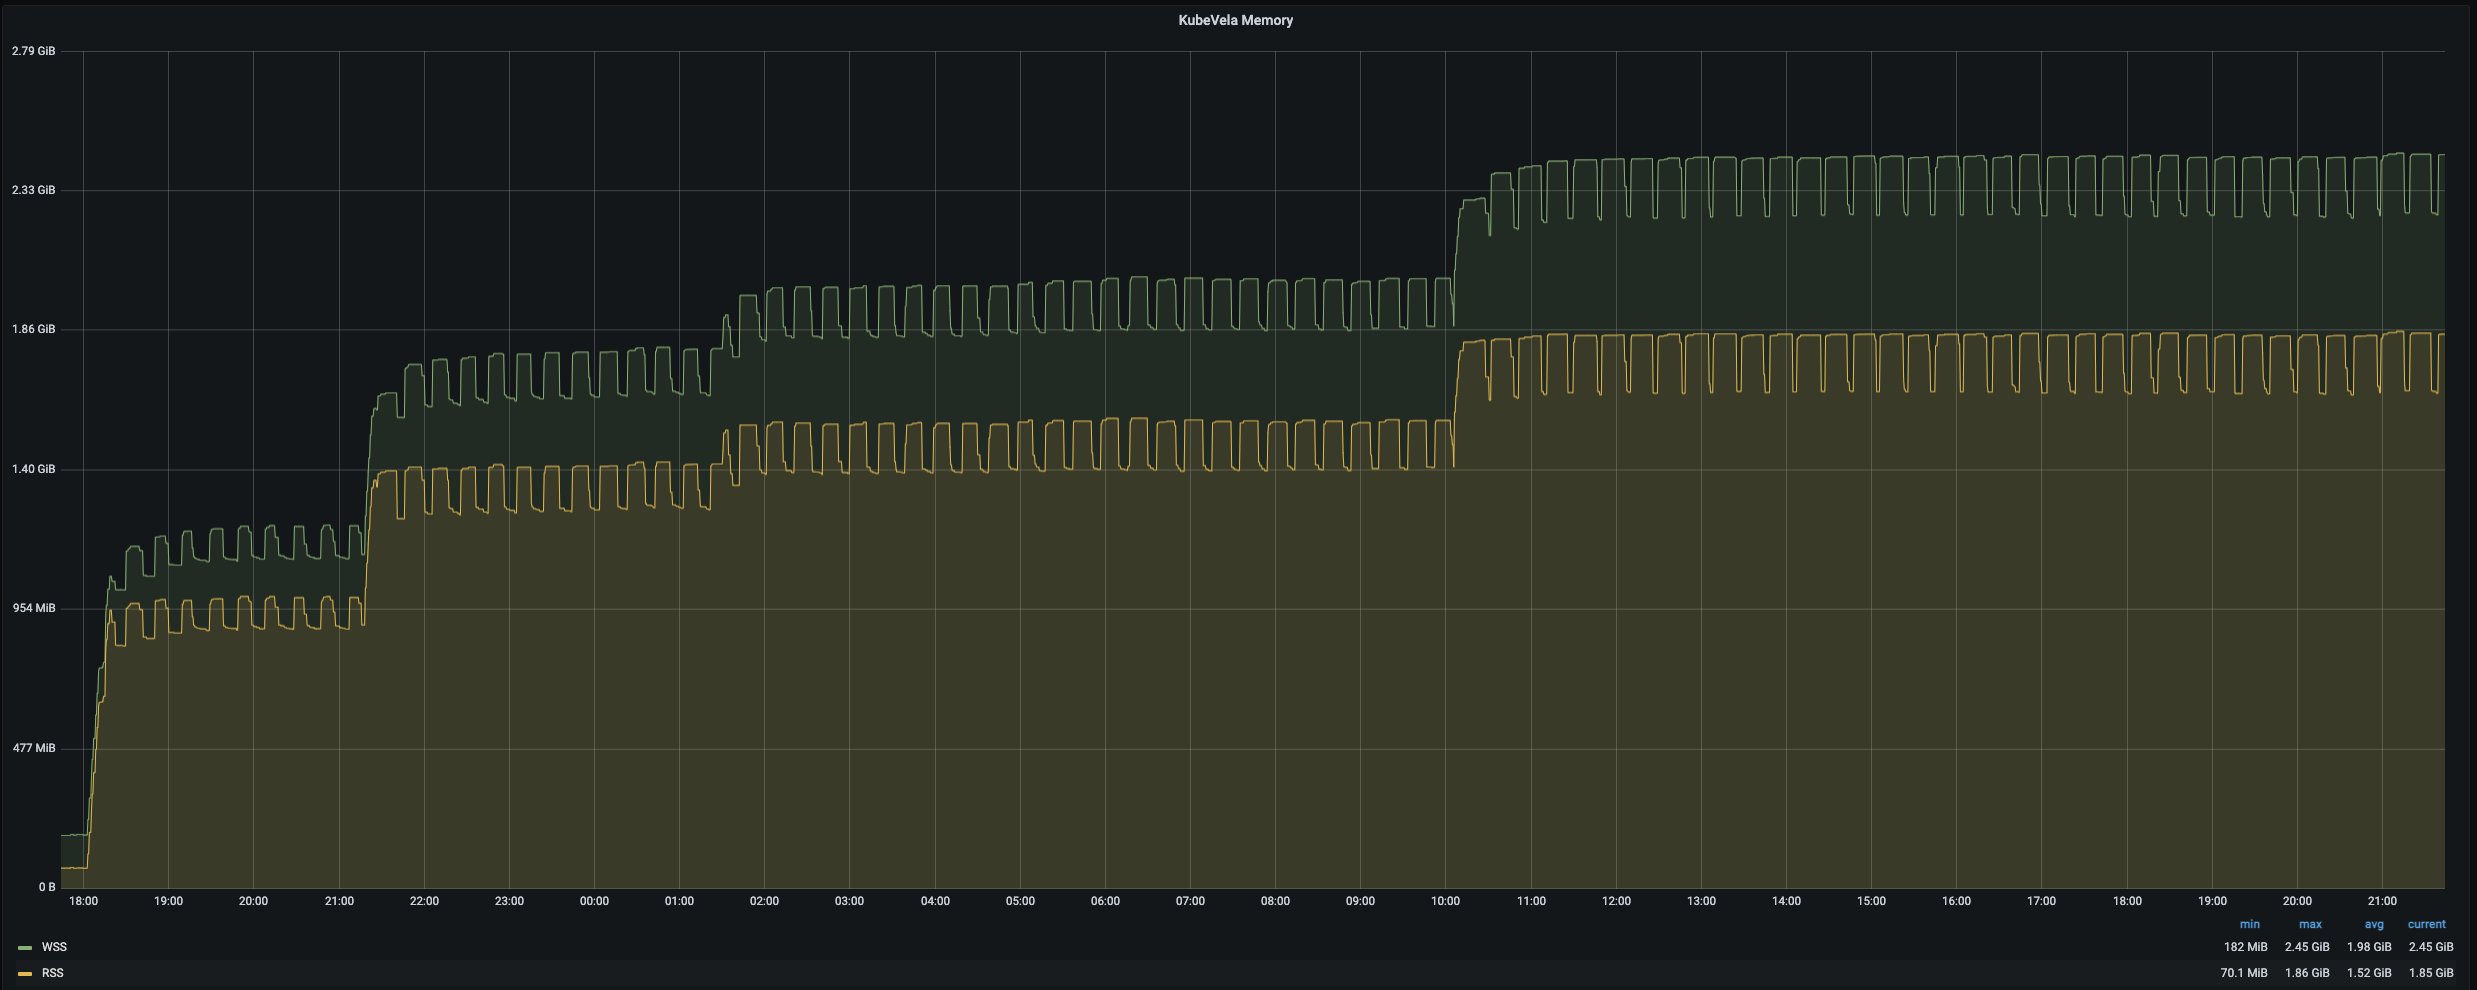
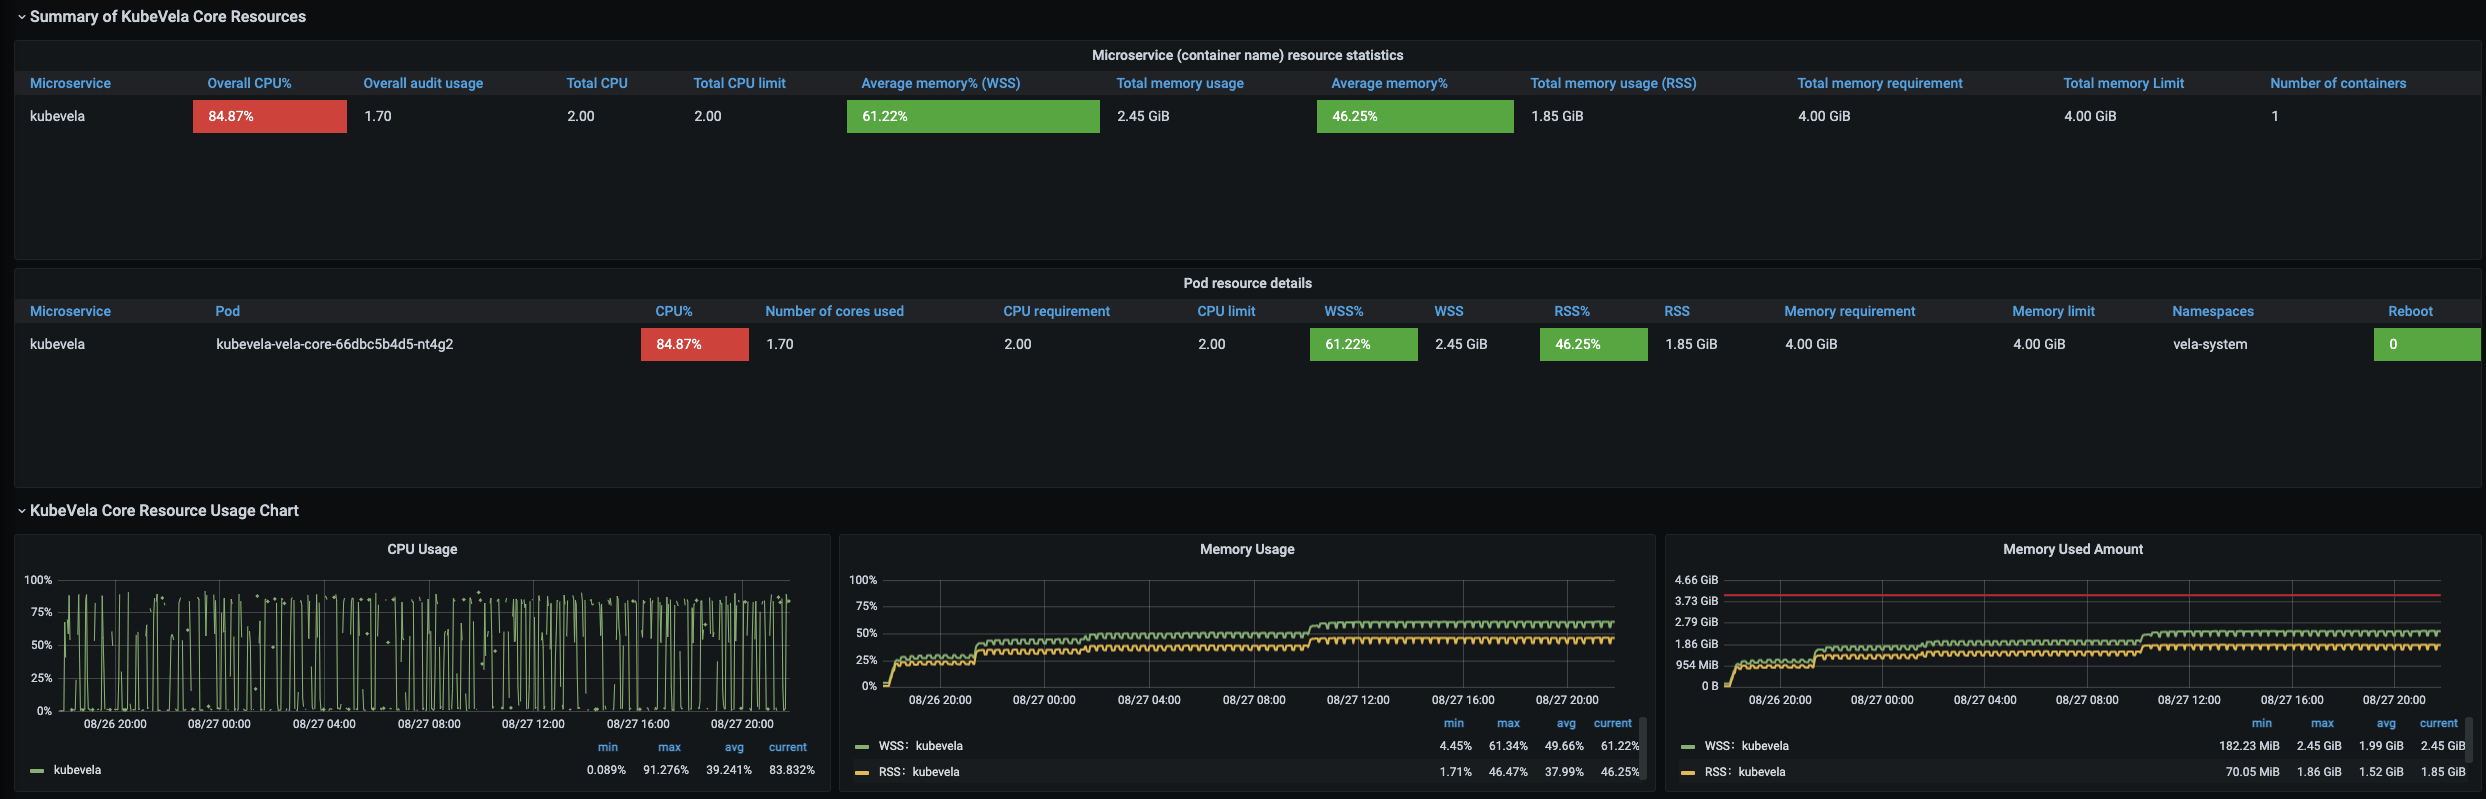
Scaling up to 12,000 applications on 1,000 nodes is much harder than previous attempts. With the same creation speed, the apiserver will be flooded by lots of pod scheduling requests and finally start to drop application creation request. To overcome this difficulty, we divide the creation process of applications into several stage. Each stage only create 1,000~3,000 applications and the next stage will not begin until all pods are ready. With this strategy, we successfully create 12,000 applications, 24,000 deployments, 12,000 services, 12,000 ingress, 12,000 configmaps and 72,000 pods. The whole process takes about 30 hours. To hold this number of applications, KubeVela controller consumes 1.7 cores and 2.45 Gi memory. It takes about 12min to finish a full turn of regular reconciles for all 12,000 applications.
Future
The performance test of KubeVela demonstrates its ability of managing thousands of applications with limited resource consumption. It can also scale up to over 10,000 applications on large clusters with 1,000 nodes. In addition, KubeVela team also conducted similar pressure test for non-deployment based applications such as CloneSet in OpenKruise (which is not enclosed in this report) and reach same conclusions. In the future, we will add more performance tests for more complex scenario like Workflow or MultiCluster.